The Leads the Cubs Keep Giving Back
The Chicago Cubs are 40–37 and the model gives them a 45% shot at October — a live contender. They are also third-worst in baseball at the one thing that decides close games: they have converted 11 saves and blown 12. Their bullpen ERA looks fine; its underlying skill does not, which is the tell that the blown leads are not bad luck about to even out. Twelve charts on how a contender is leaking wins out of the ninth inning — and what the trade deadline could actually buy to stop it.
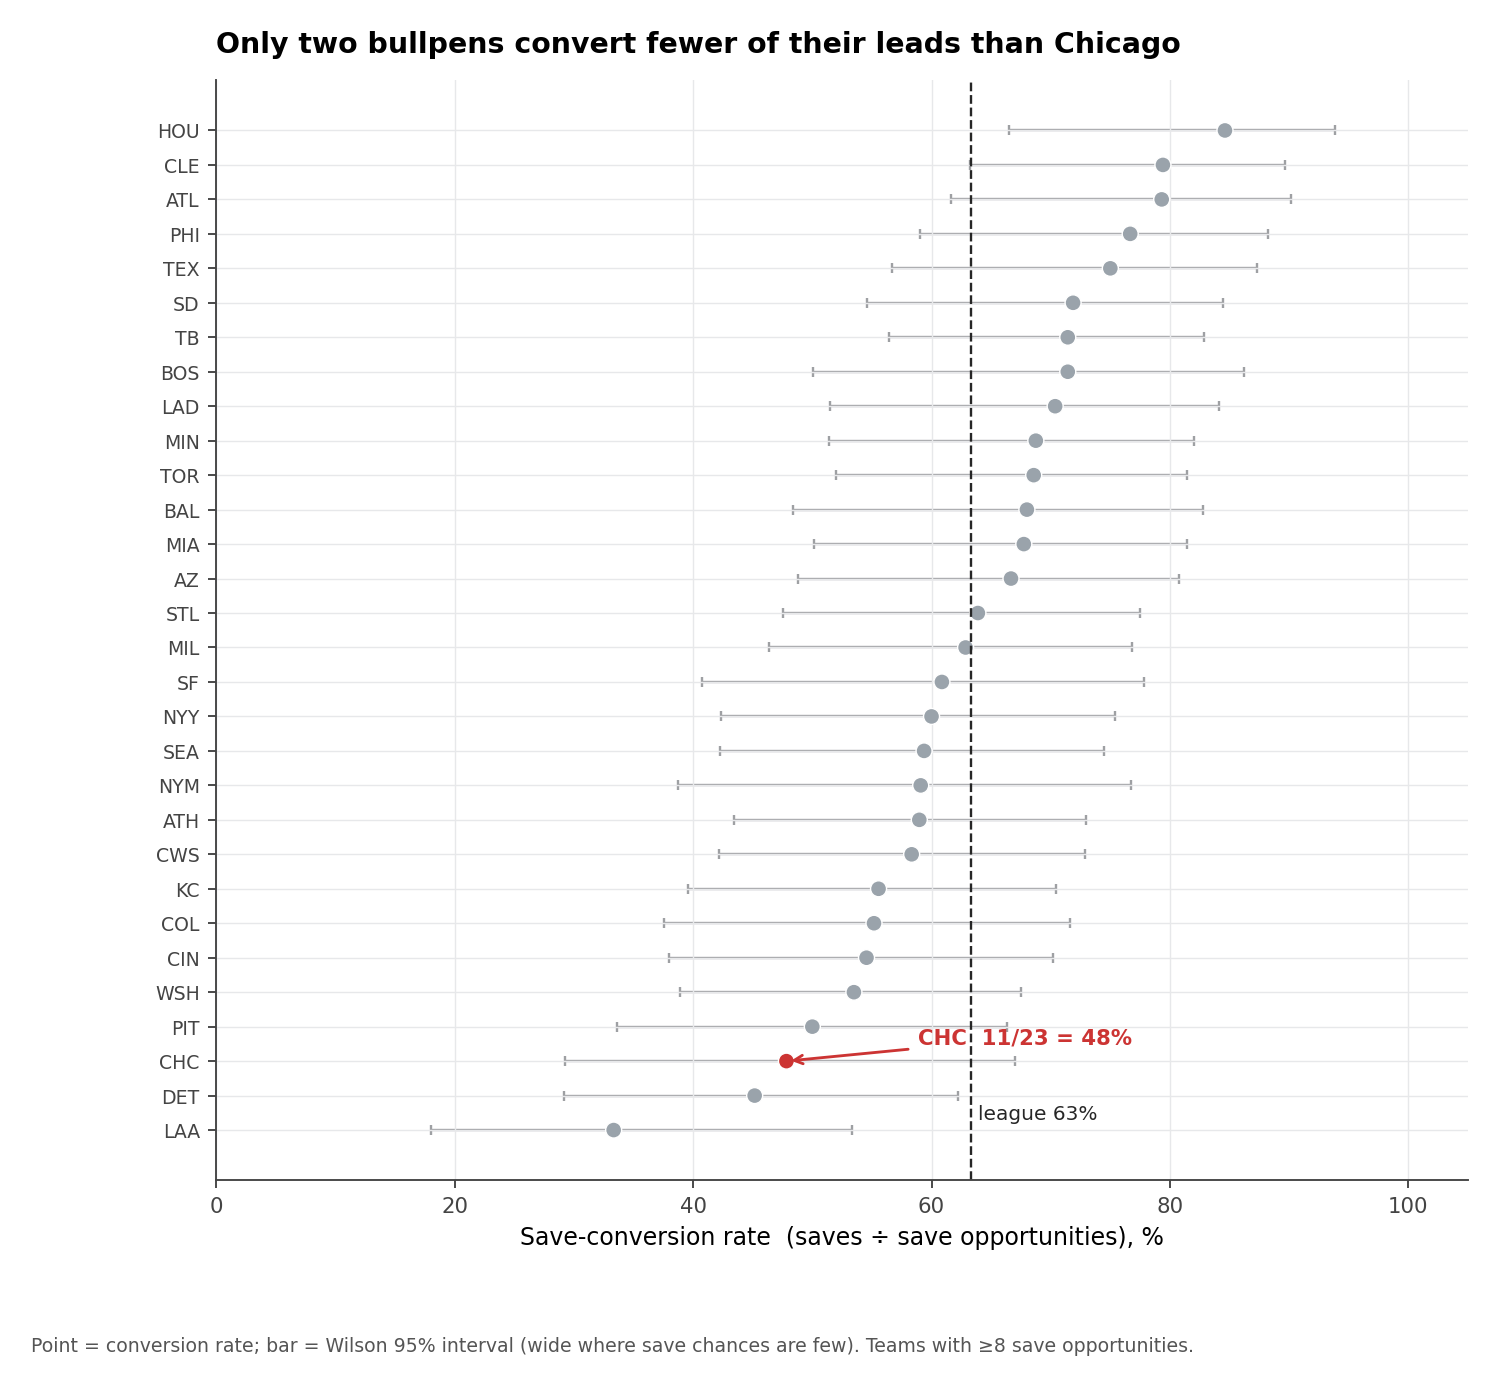
Forty-eight percent.
That is the share of save chances the Cubs have actually closed out: 11 saved, 12 blown, 23 opportunities. Only the Angels (33%) and the Tigers (45%) have been worse, and both of those teams are well under .500 and out of the race — for them a blown lead is a footnote on a lost season. The Cubs are the awkward case: a team good enough that every surrendered lead costs something real. The league as a whole converts 63% of its save chances. Chicago converting at 48% is not a rounding error; it is the difference between a bullpen that protects a contender and one that quietly undermines it.
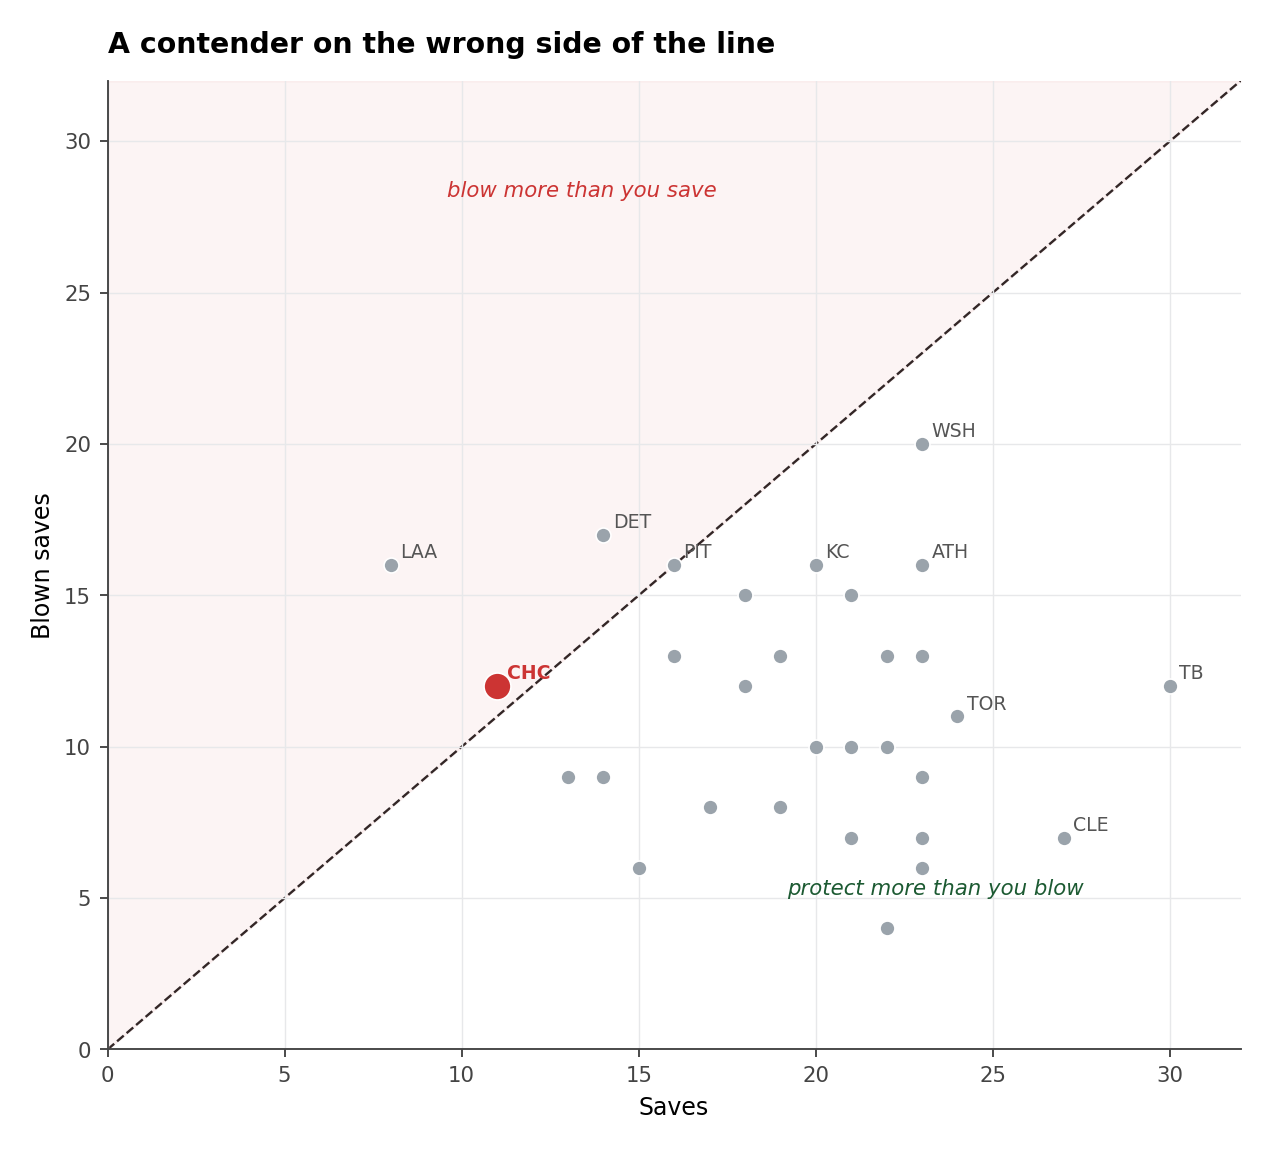
The blunter version: most bullpens save more leads than they blow. The Cubs do the opposite. Plot every team’s saves against its blown saves and almost everyone sits comfortably below the break-even diagonal. Chicago is above it.
Why a blown lead is the most expensive out in baseball
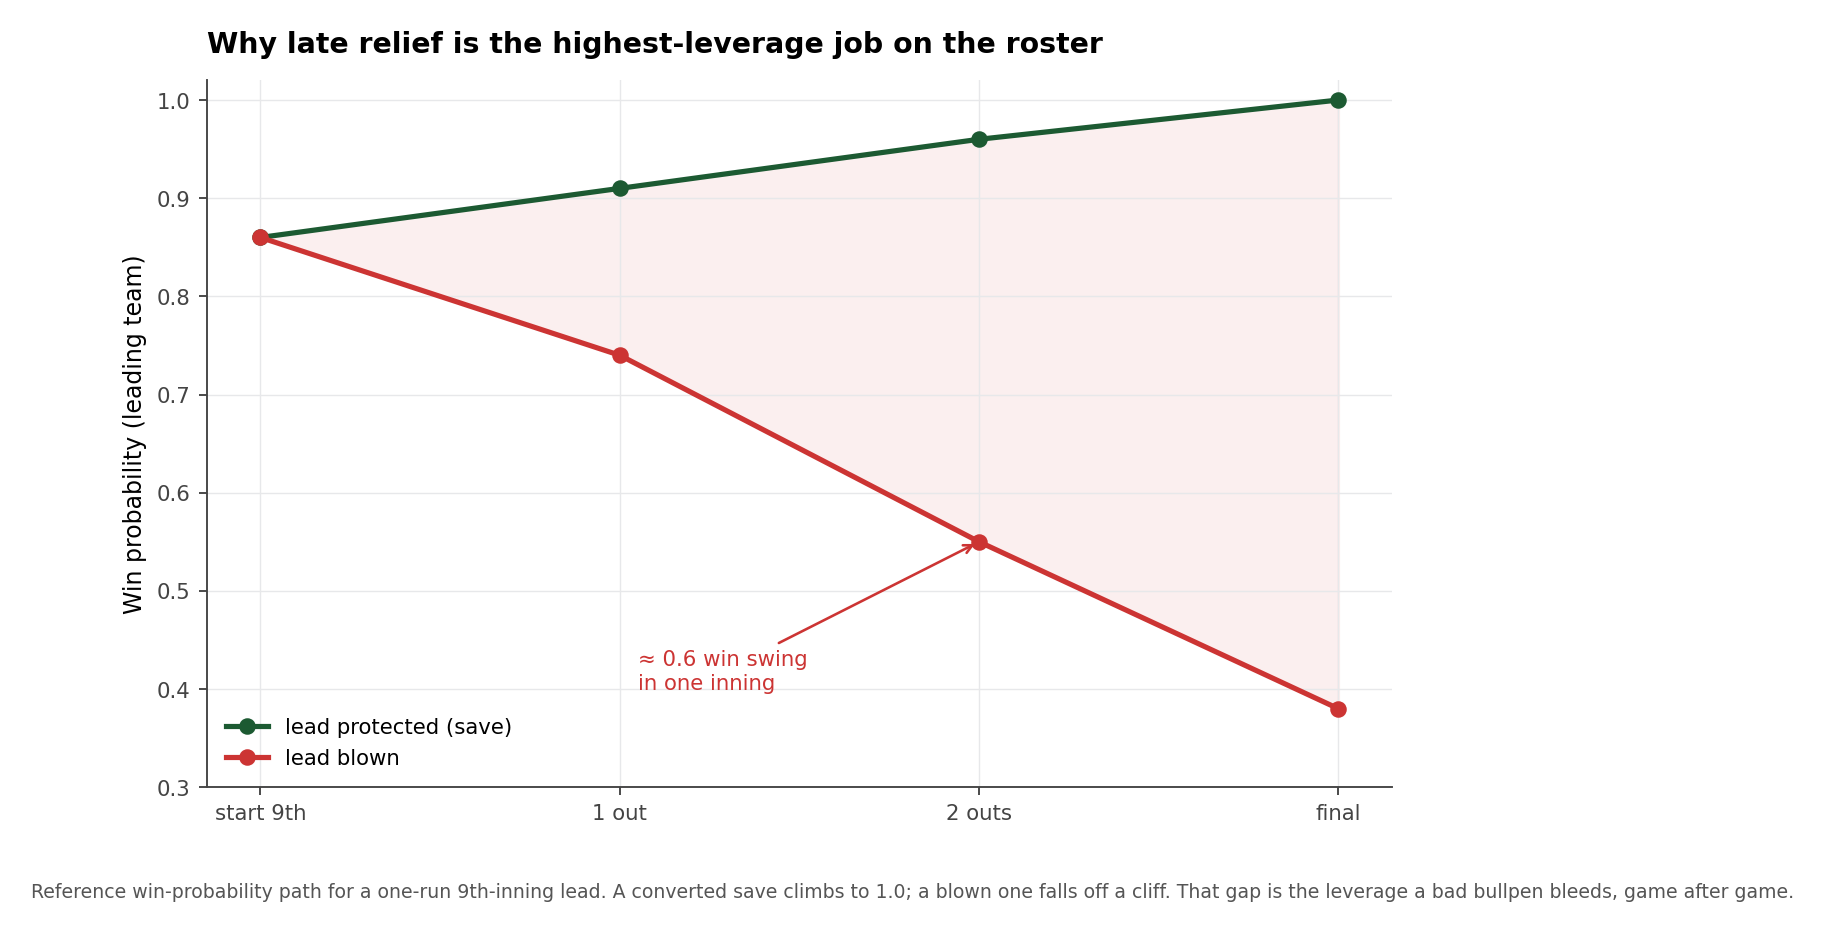
A save situation is, by definition, the highest-leverage spot on the field: a lead late, with the game in the balance. Win probability for the leading team walking into the ninth with a one-run lead sits around 86%; close it out and it climbs to 100; let the leadoff man on and watch a rally build and it falls off a cliff. The swing between protecting and blowing a single one-run ninth is on the order of 0.6 wins — in one inning. That is the currency a bad bullpen burns, night after night.
It isn’t luck — the skill is worse than the results
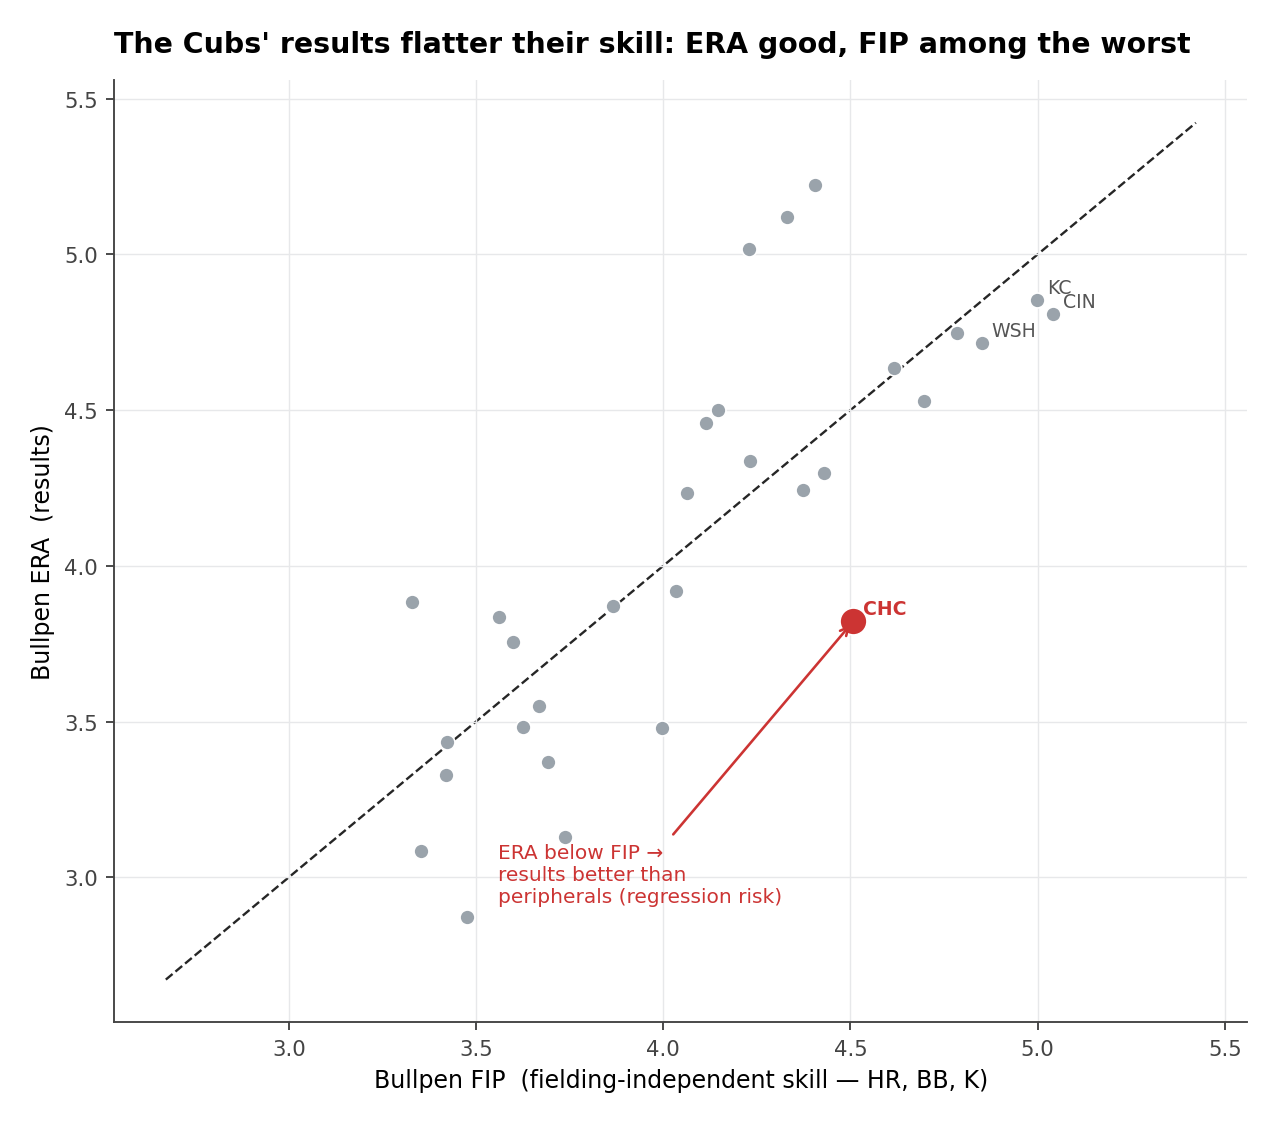
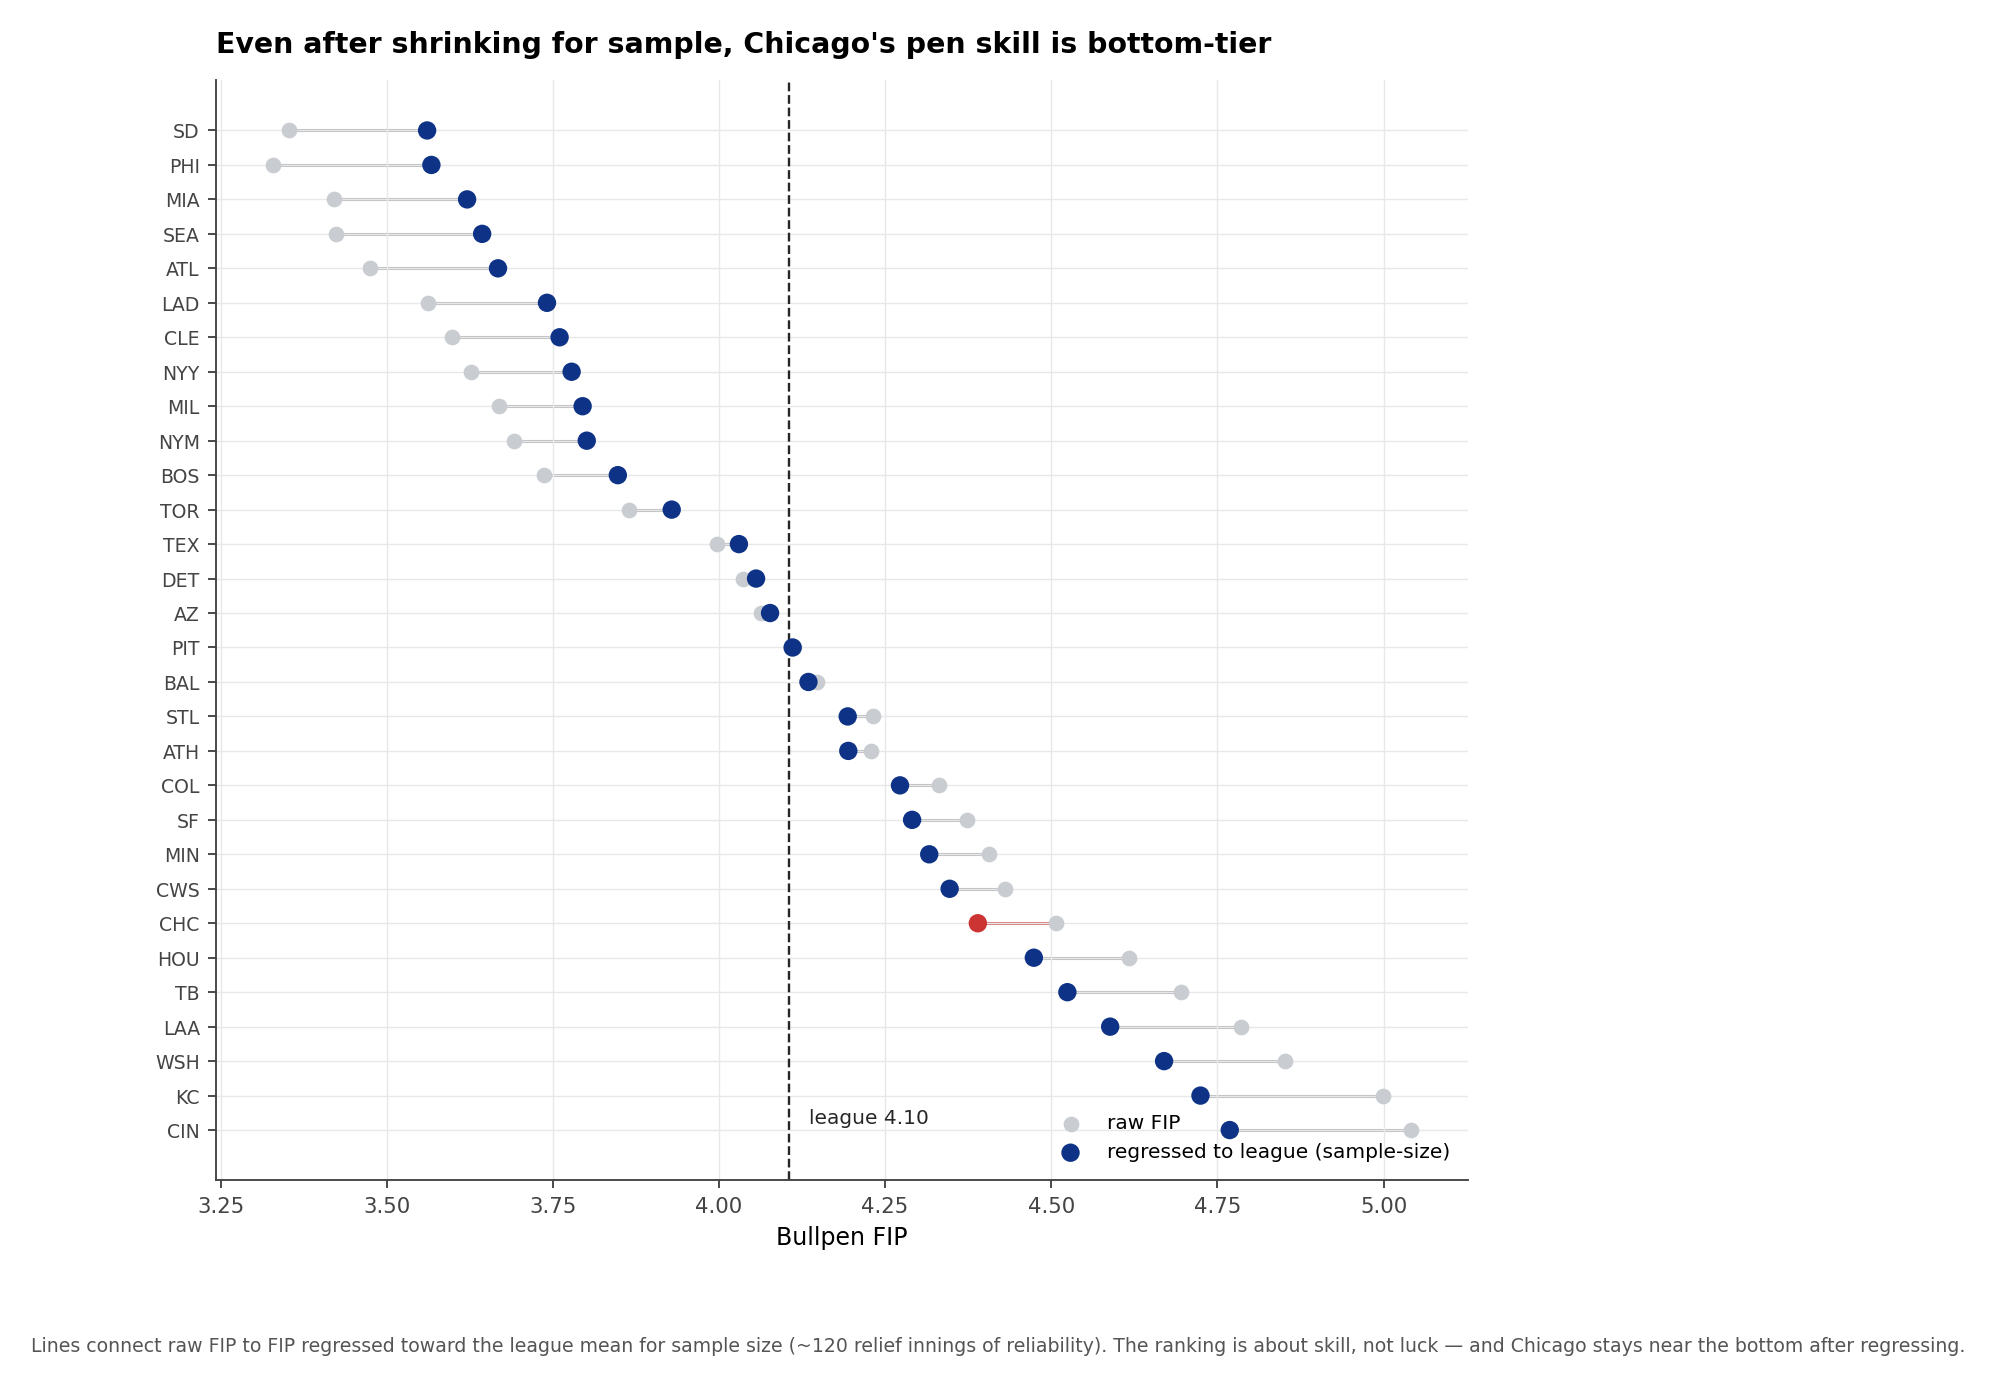
The reflexive defence of any team blowing leads is “small sample, it’ll regress.” Usually that is right. Here it points the wrong way. The Cubs’ bullpen ERA — 3.82 — is actually a touch better than the 4.10 league mark. But ERA is a results stat, full of sequencing and defence and timing. Strip those out and look at fielding-independent pitching (FIP), which keeps only what a pitcher controls — strikeouts, walks, home runs — and the Cubs come in at 4.51, bottom-seven in the majors. Their results are flattering their stuff.
Because FIP on a half-season of bullpen innings is still noisy, it is worth regressing each team’s number toward the league mean in proportion to how few innings it is built on — a sample-size-aware estimate of true talent rather than a raw rate. Do that and Chicago barely moves: even after the most charitable statistical treatment, this is a bottom-tier bullpen by skill.
Where the leak is
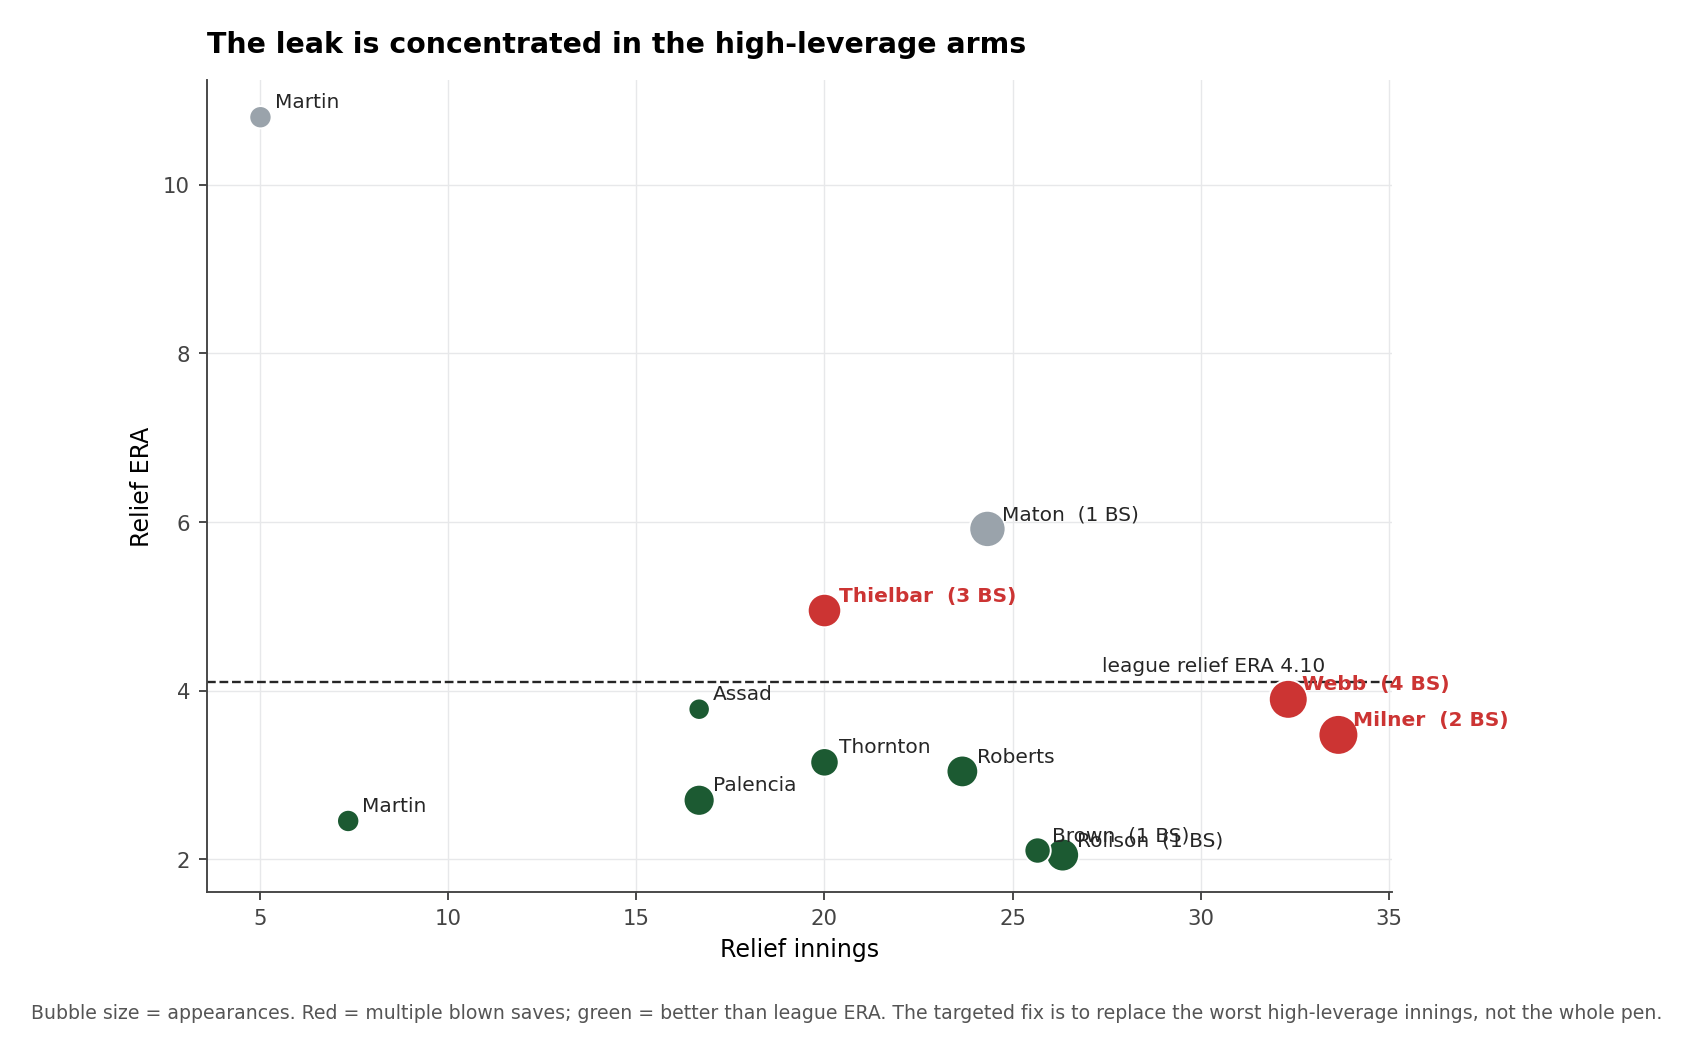
The good news for a front office: this is not a whole-bullpen problem, it is a high-leverage problem. Daniel Palencia (2.70 ERA, three saves, no blown), Ryan Rolison (2.05) and Ben Brown (2.10) have been genuinely good. The damage is concentrated in the arms getting the biggest spots. Jacob Webb has blown four saves on his own; Caleb Thielbar has blown three at a 4.95 ERA; Hoby Milner has added two; Phil Maton is carrying a 5.92. Four relievers account for nearly all of the blown leads.
What it has cost — in wins
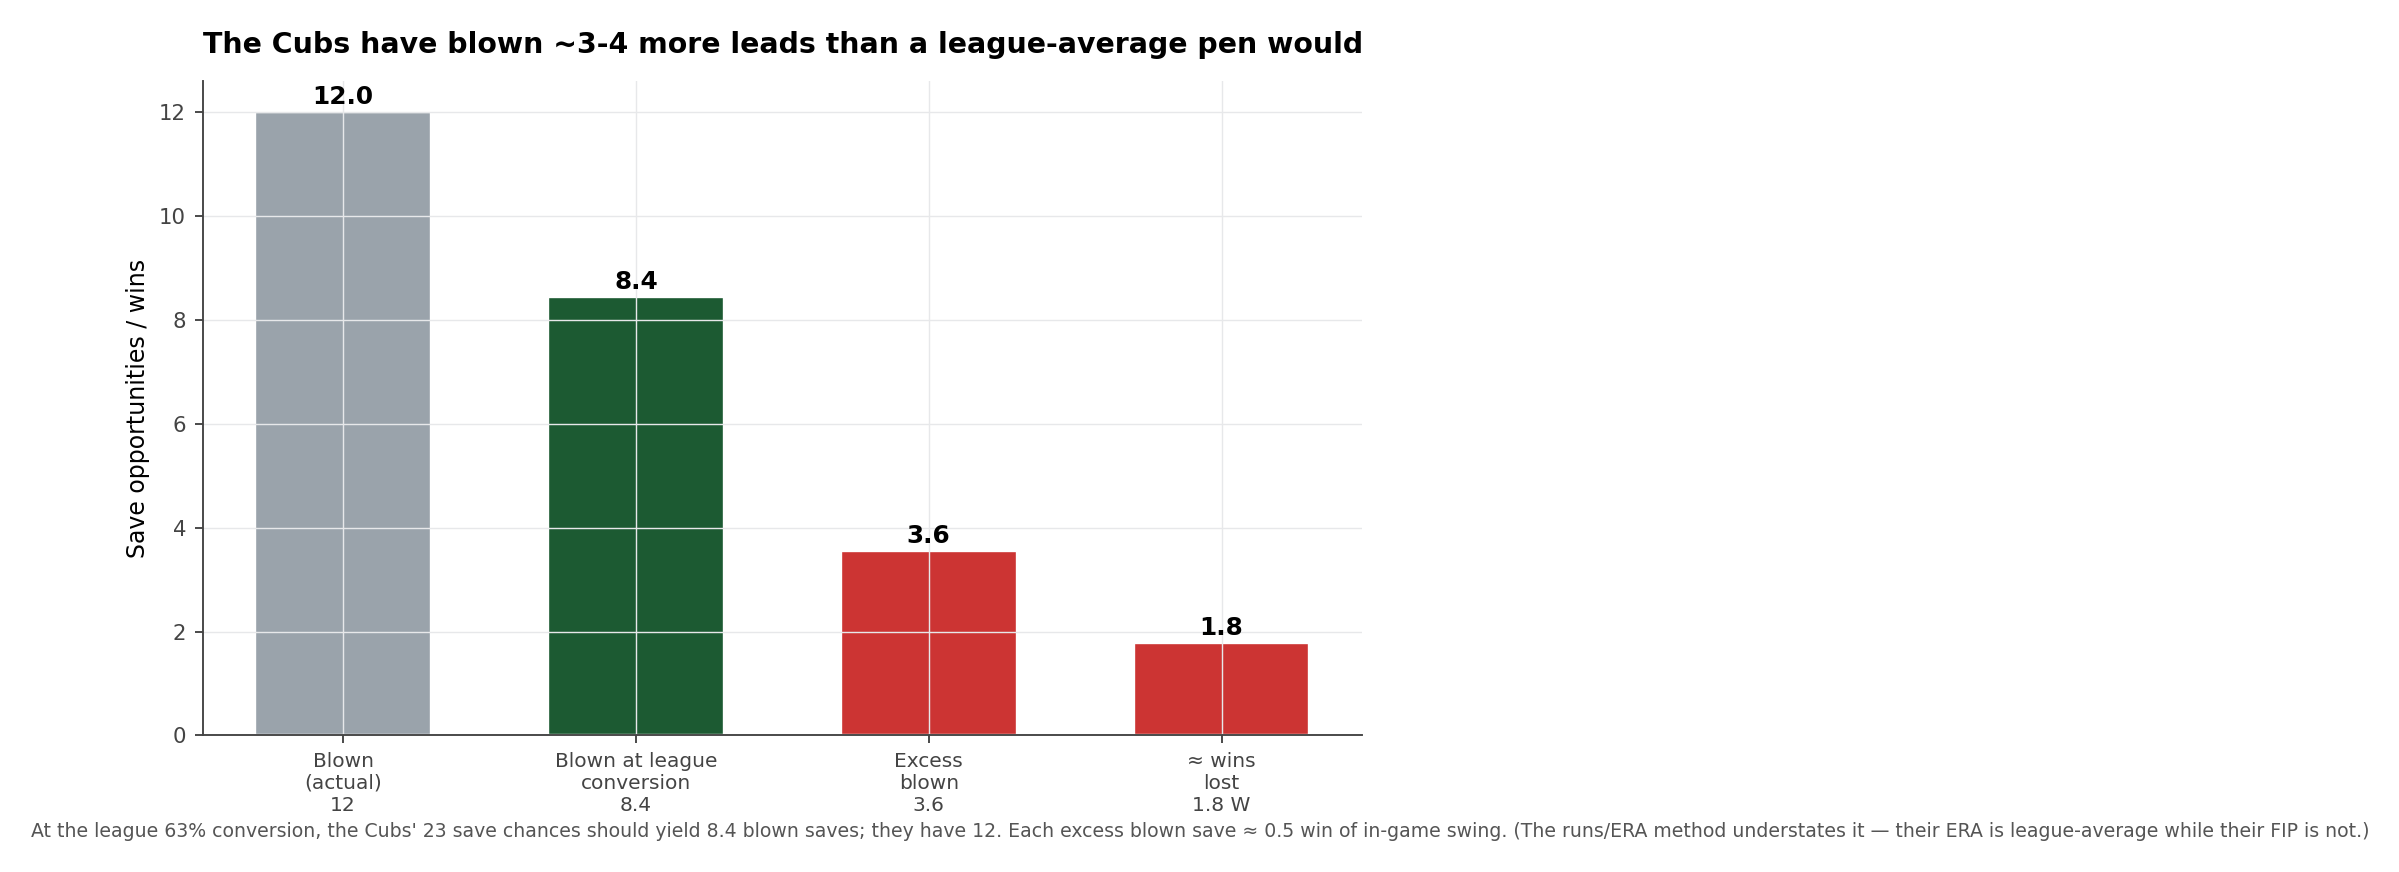
Put a number on it. At the league’s 63% conversion rate, the Cubs’ 23 save chances should have produced about 8.4 blown saves. They have 12 — roughly 3.6 more than an average bullpen would have surrendered. Each of those excess blown leads is worth on the order of half a win once you account for the win-probability swing of giving a late lead back. That is about 1.8 wins already left on the table — and note the runs-and-ERA method understates the problem here, because their ERA is league-average while their skill is not.
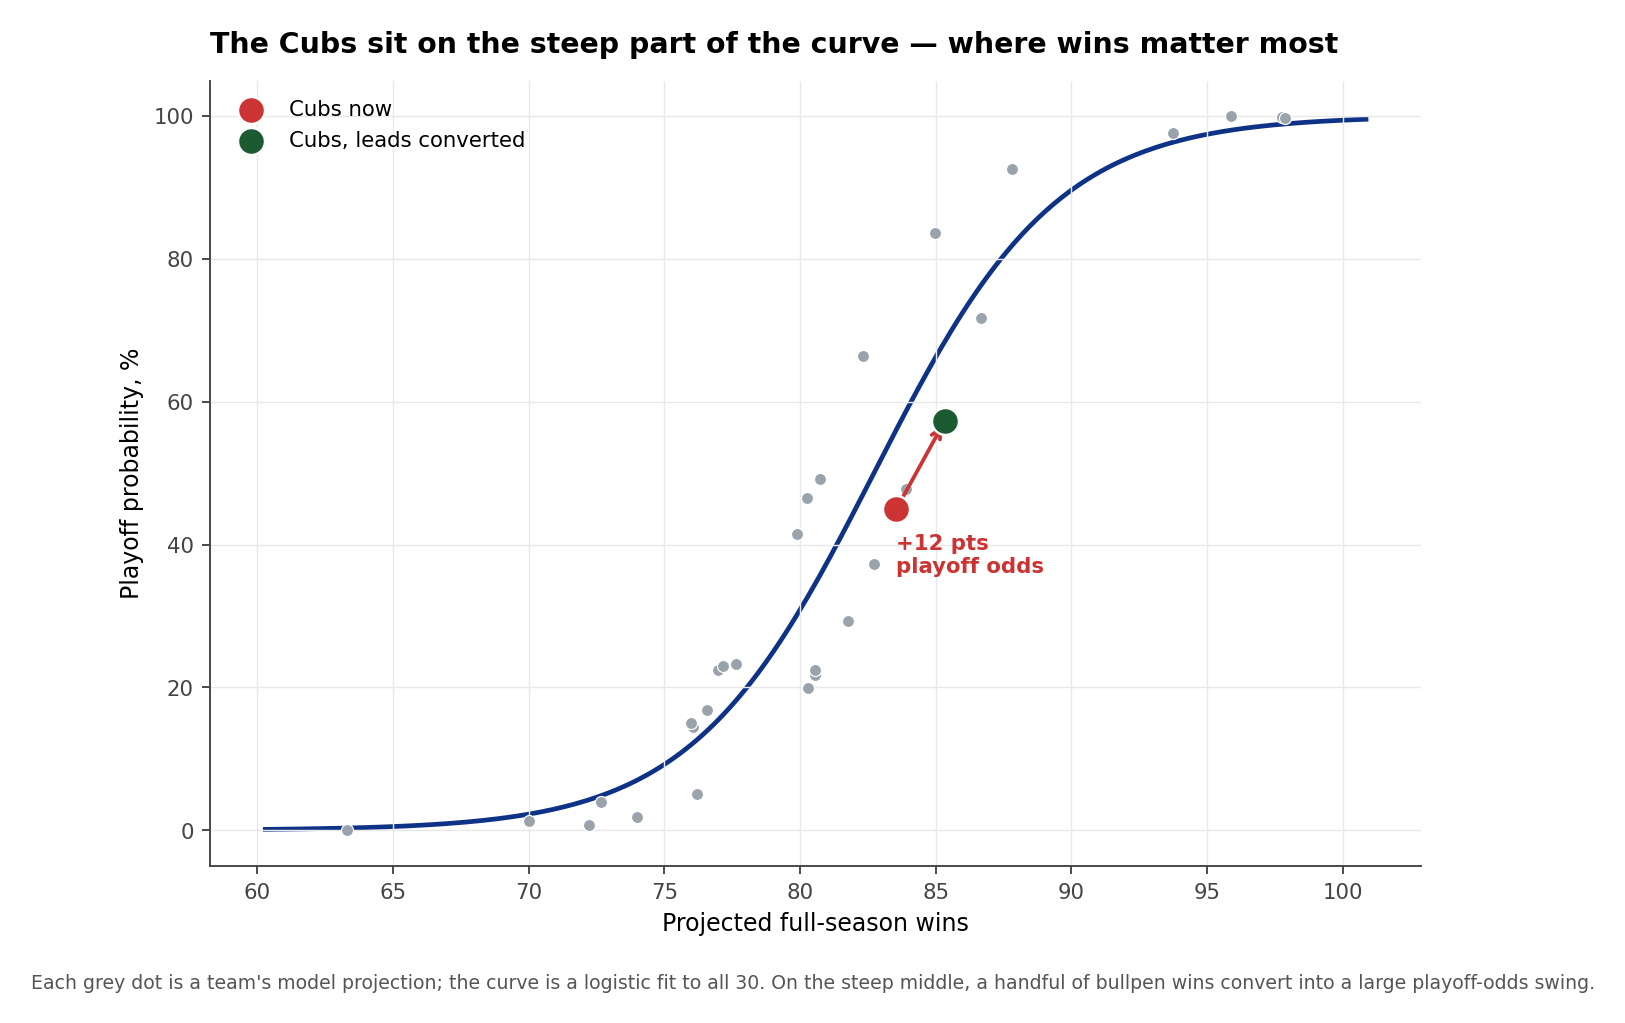
Why those wins matter so much here
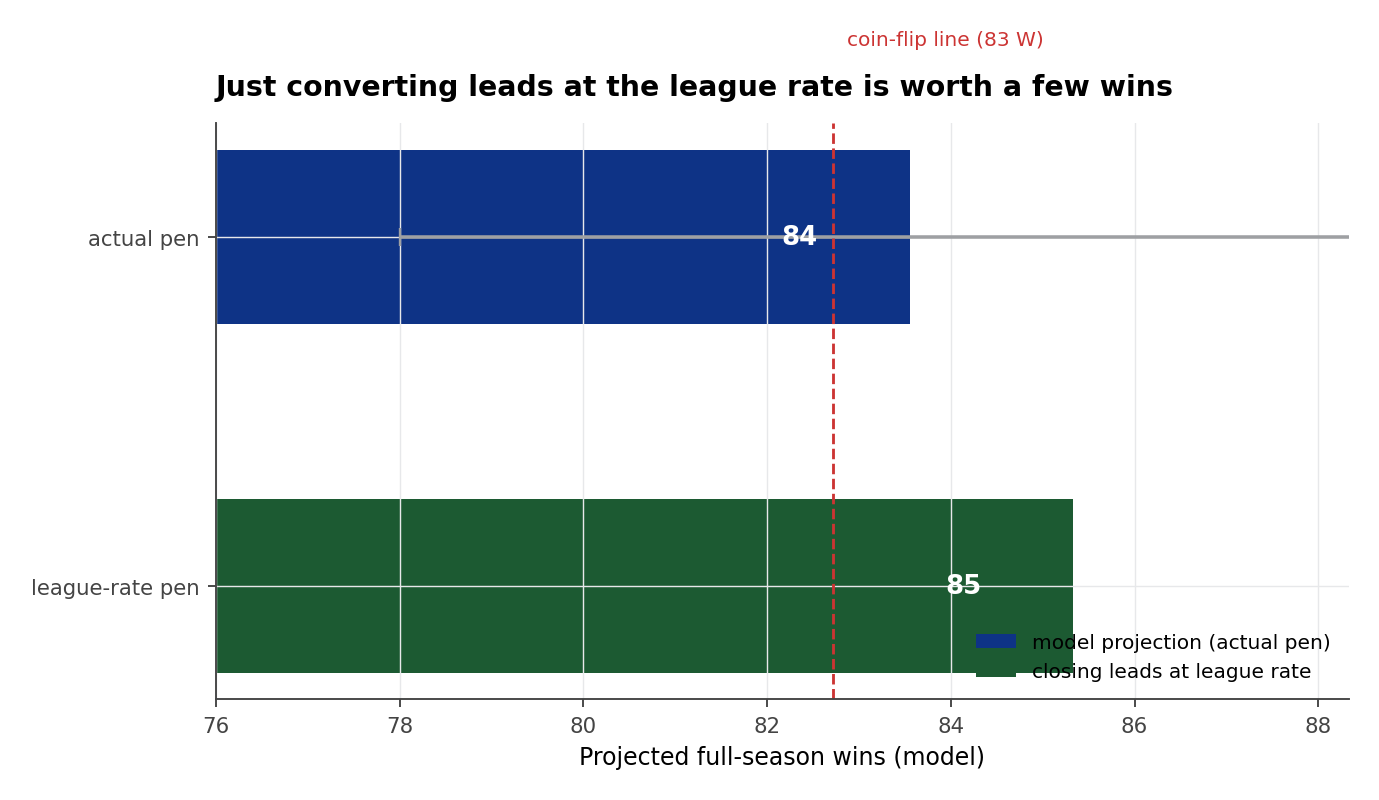
A win is not worth the same to every team. The model projects the Cubs to about 84 wins, and the relationship between projected wins and playoff probability across the league is a steep S-curve right around their total. Chicago is sitting on the steepest part of it — the stretch where a couple of extra wins move the needle most. Simply converting leads at the league-average rate lifts their projection across the coin-flip line and their playoff odds from 45% to about 57%.
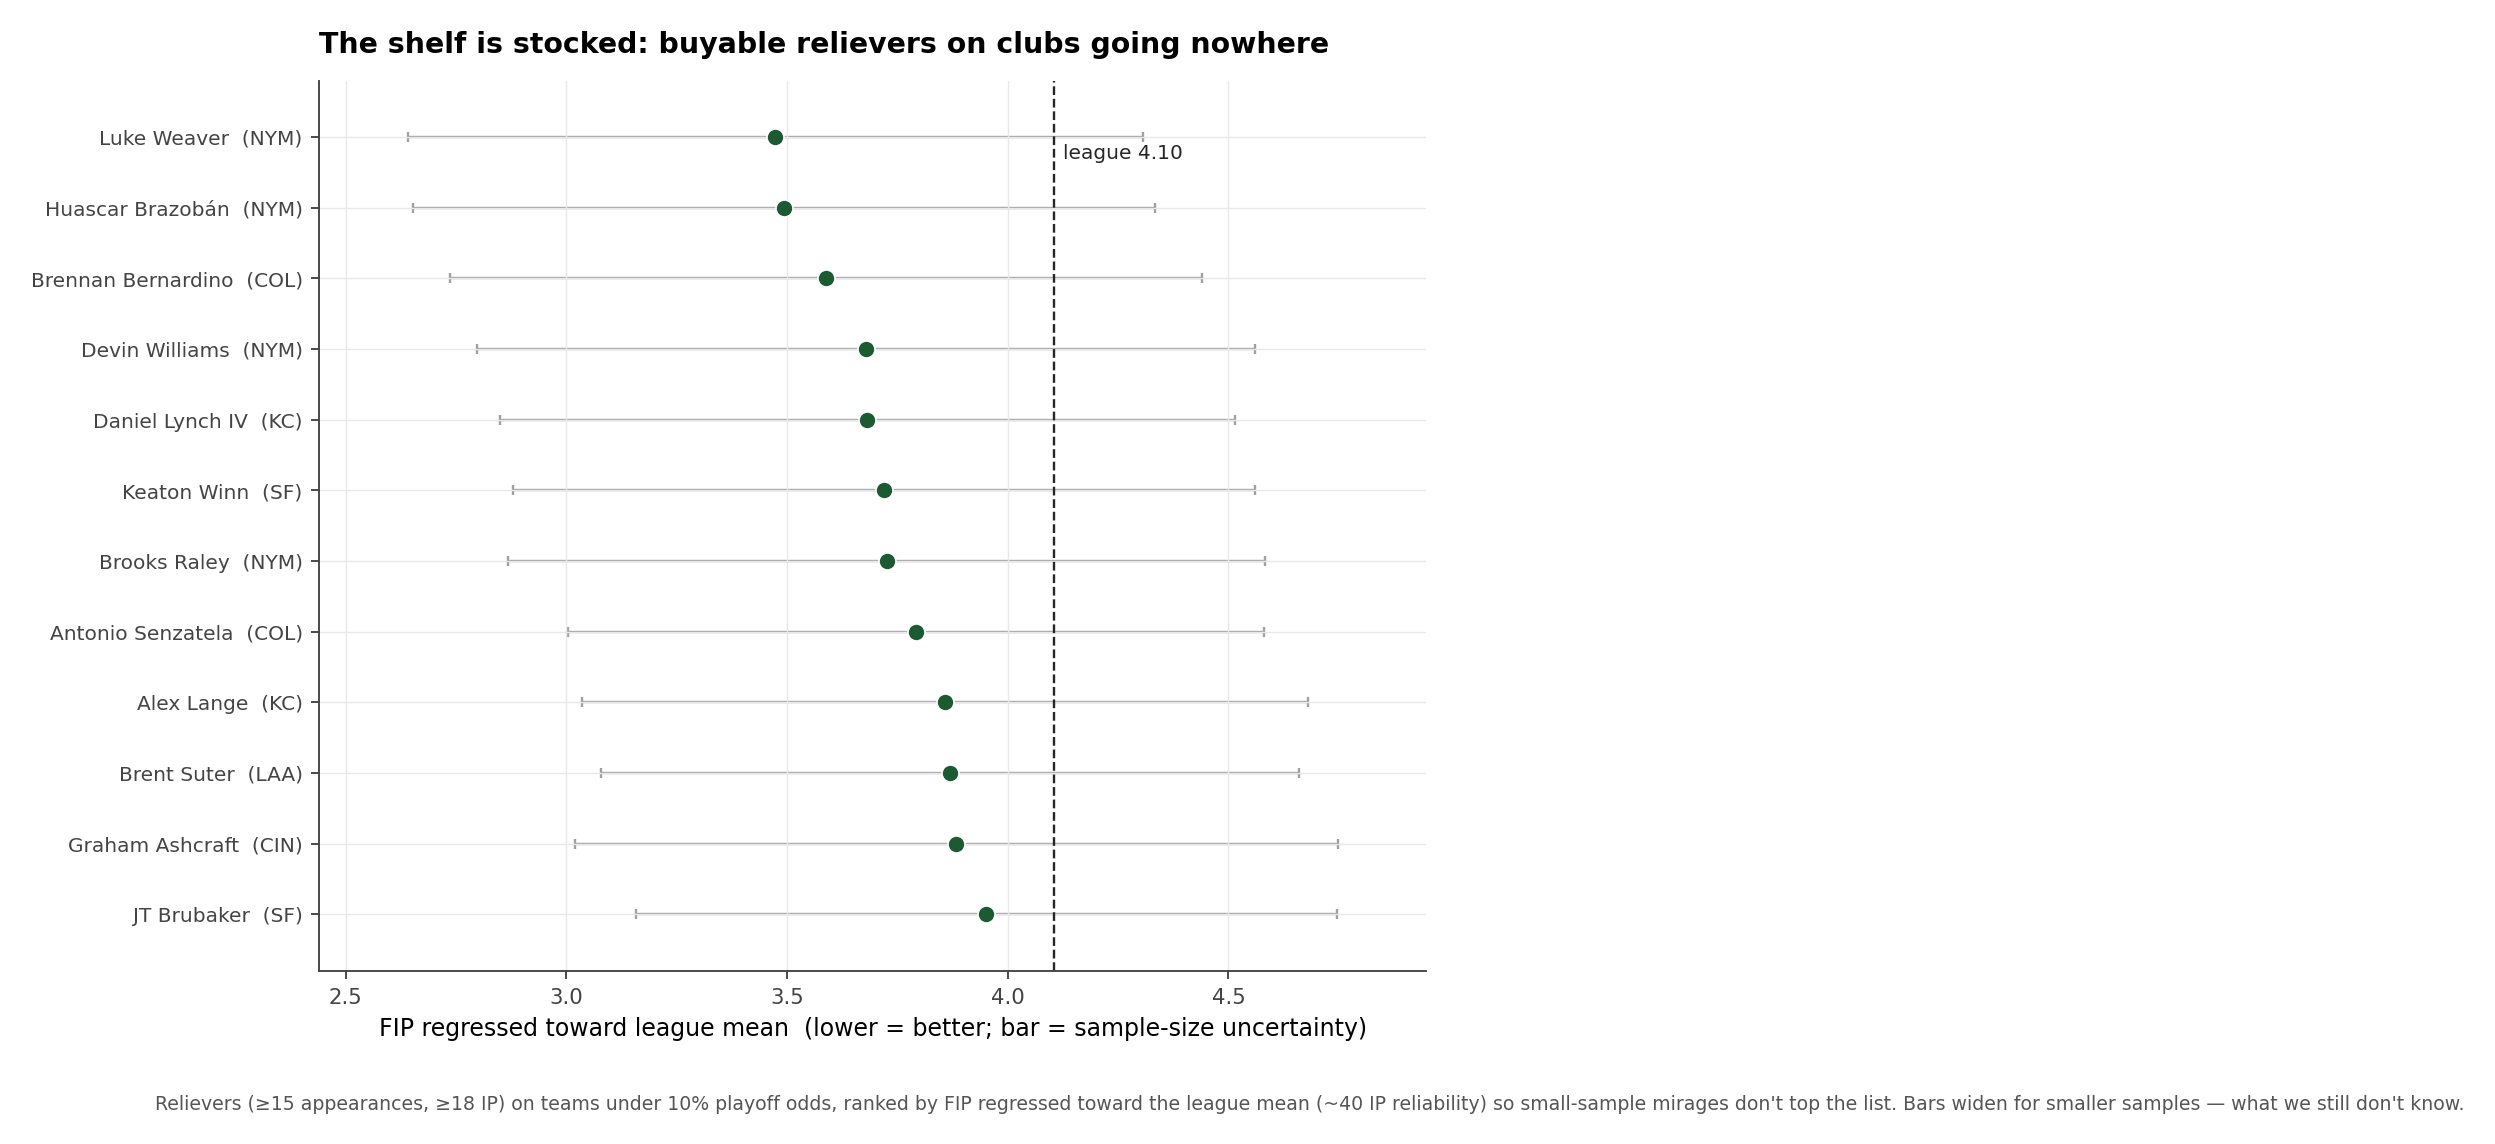
The deadline has what they need
The market cooperates. Rank the relievers on clubs the model has under 10% playoff odds — the sellers — by FIP regressed toward the league mean for sample size, and the shelf is deep. The Mets have quietly fallen out of it and are carrying Devin Williams, Luke Weaver and Huascar Brazobán; Colorado has Brennan Bernardino; there are useful arms in Kansas City and Cincinnati. The uncertainty bands are wide — half a season of relief is not much to judge on — but the better bets sit clearly below the league line.
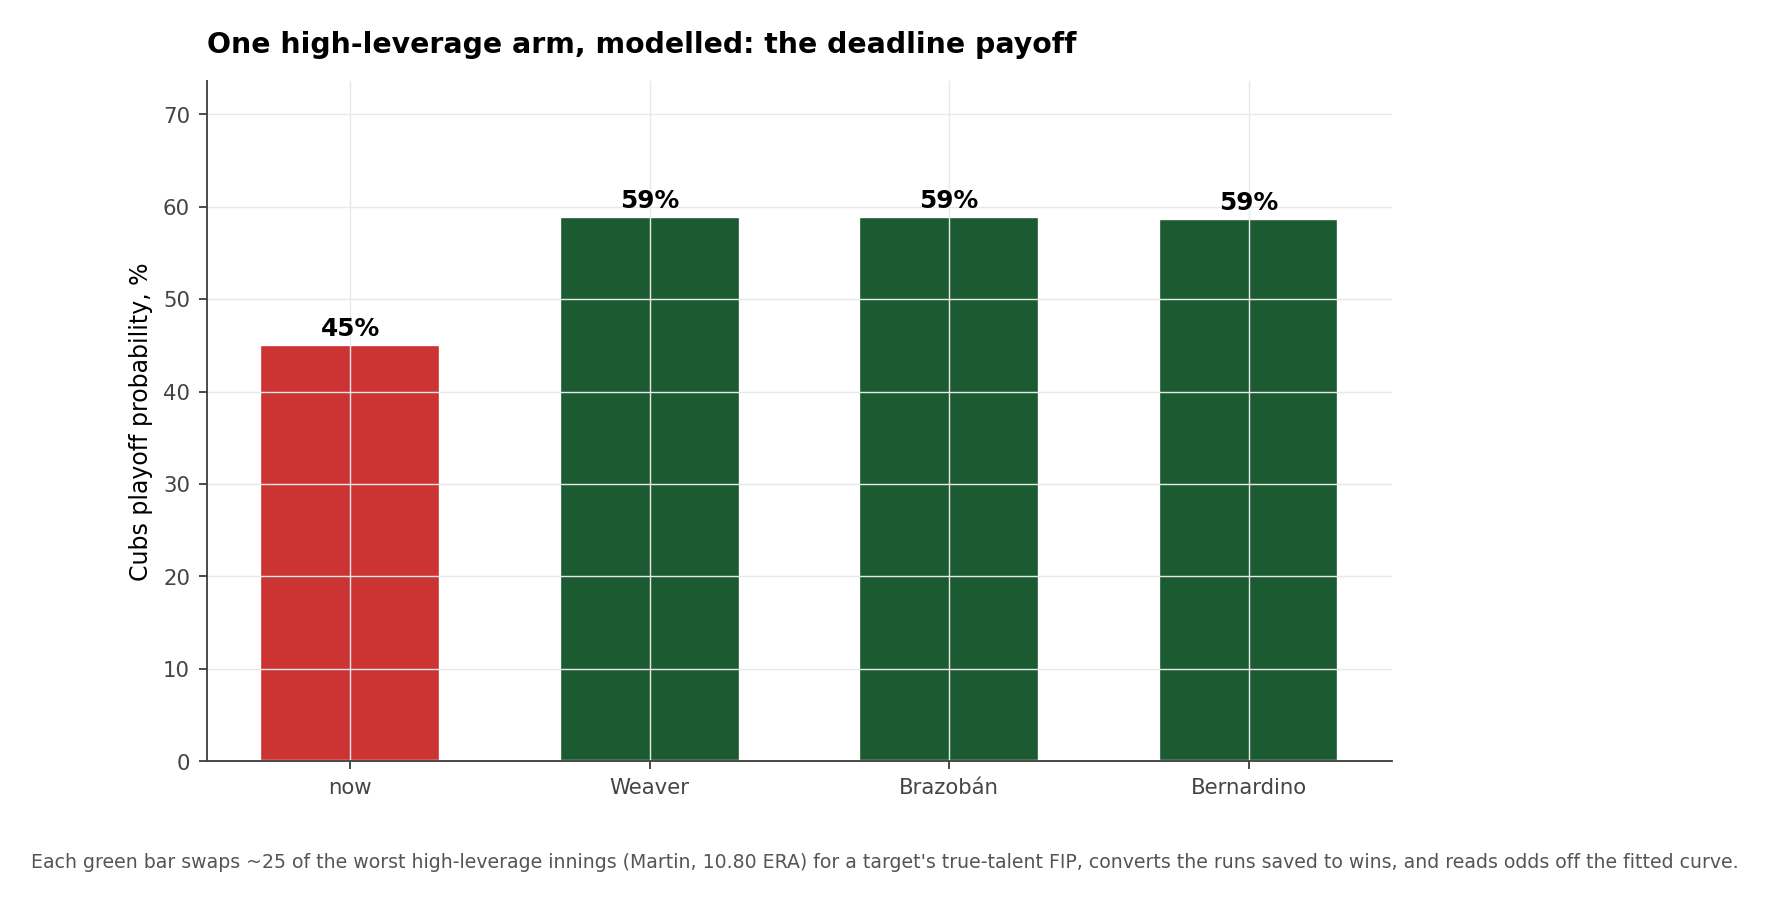
Model the move directly: take roughly 25 of the worst high-leverage innings off the books and hand them to a target arm’s true-talent rate, convert the runs saved into wins, and slide back along the playoff curve. A single high-end reliever pushes the Cubs’ October odds up several more points on top of the league-rate baseline.
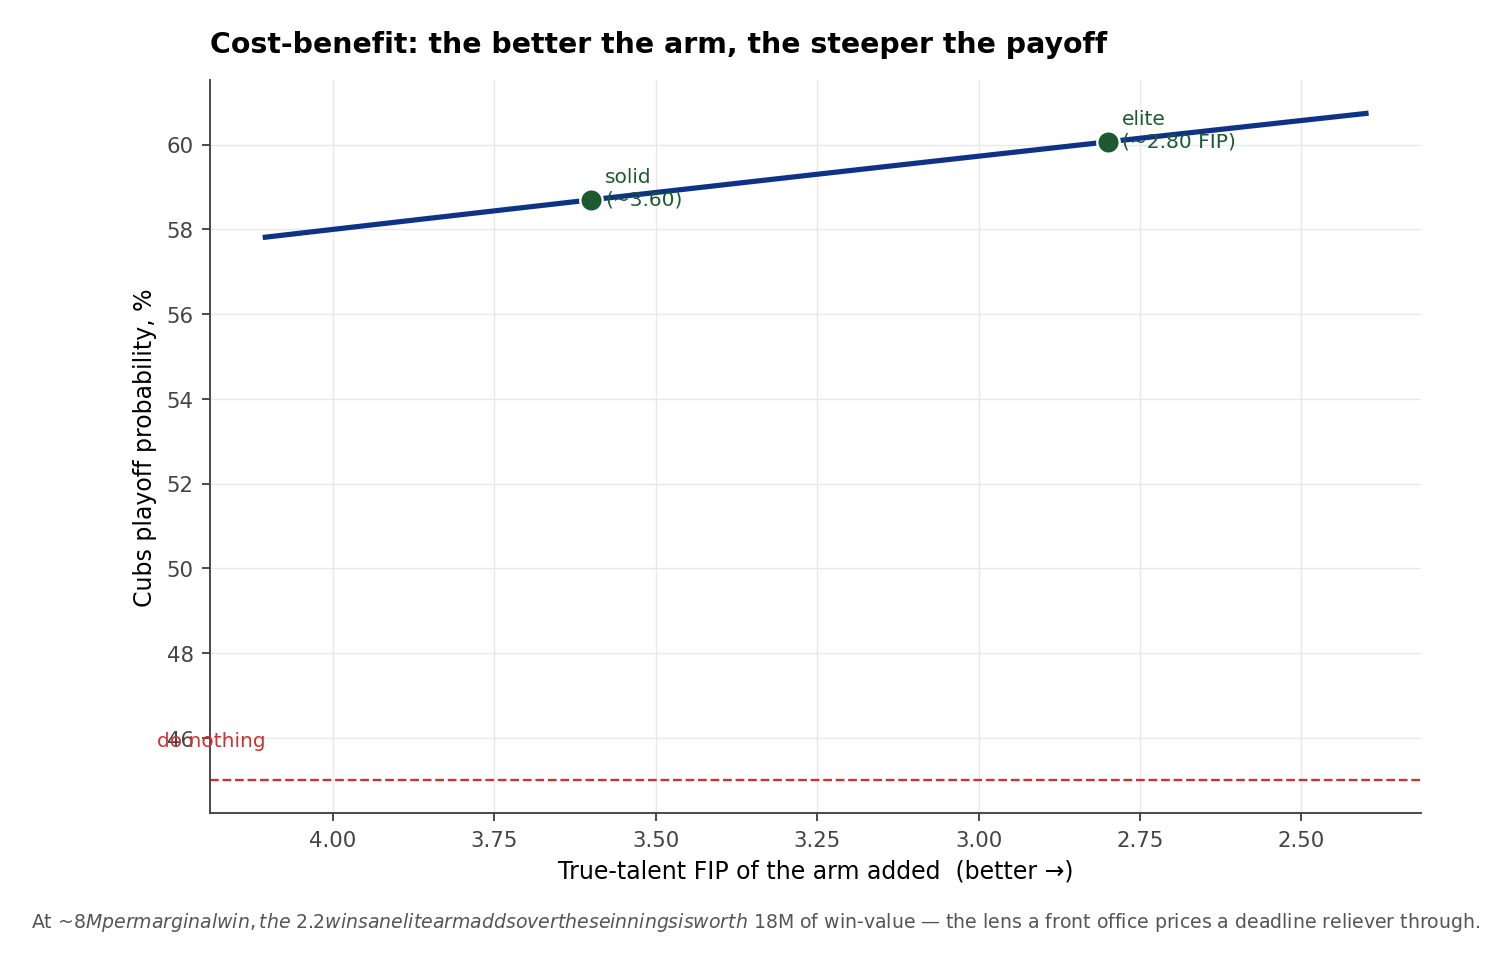
The economics
This is how a front office actually prices it. A marginal win costs roughly $8M on the open market. The bullpen has already given back something like two wins, and a genuine high-leverage upgrade is worth a couple more down the stretch — call it $20–30M of win-value, against a deadline reliever who costs a prospect or two and a few million in salary. The better the arm, the steeper the payoff, and the Cubs’ position on the curve makes the return on a good one unusually high.
What this tells us
The Cubs do not have a bad-luck bullpen that is about to fix itself. They have a unit whose results have been quietly outrunning its skill, concentrated in the exact innings that decide games, on a team sitting precisely where wins are most valuable. Three blown leads’ worth of regression is more likely ahead of them than behind. The deadline market is stocked with the arms to fix it, and the playoff-odds math says a single high-leverage addition is one of the highest-return moves available to any contender this summer. For a 45% team, closing games is not a luxury — it is the cheapest path to October on the board.
Method. Bullpen lines are aggregated from the per-appearance pitcher game logs (regular season, relief outings). Save-conversion intervals are Wilson binomial; bullpen true-talent FIP is regressed toward the league mean by sample size (a stabilization-constant shrinkage, heavier the fewer innings a pen has thrown). Wins lost use the excess of blown saves over a league-average converter, valued at the win-probability swing of a blown lead; the playoff-odds counterfactual fits a logistic of playoff probability on projected wins across all 30 clubs and slides the Cubs along it from their actual model odds. Reliever targets are ranked by the same sample-size-regressed FIP among teams under 10% model playoff odds. Figures reflect data through 2026-06-21.