The Nine-Pitch Answer to Chicago’s Back-End Hole
The White Sox are 41–38 and the model gives them a 53% shot at October — a real contender behind ace Davis Martin and a rotation that falls off a cliff after him. The rumour has them landing Seth Lugo from the 34–47 Royals for a back-of-top-ten prospect. This is the full data-science version of that rumour: what Lugo’s true talent actually is once you shrink the sample, how many wins he is worth with the uncertainty kept in, what that does to the October math — and the part the rumour only asserts, the breakeven that says how far up the prospect board Chicago can go before the trade stops paying. Eleven charts.
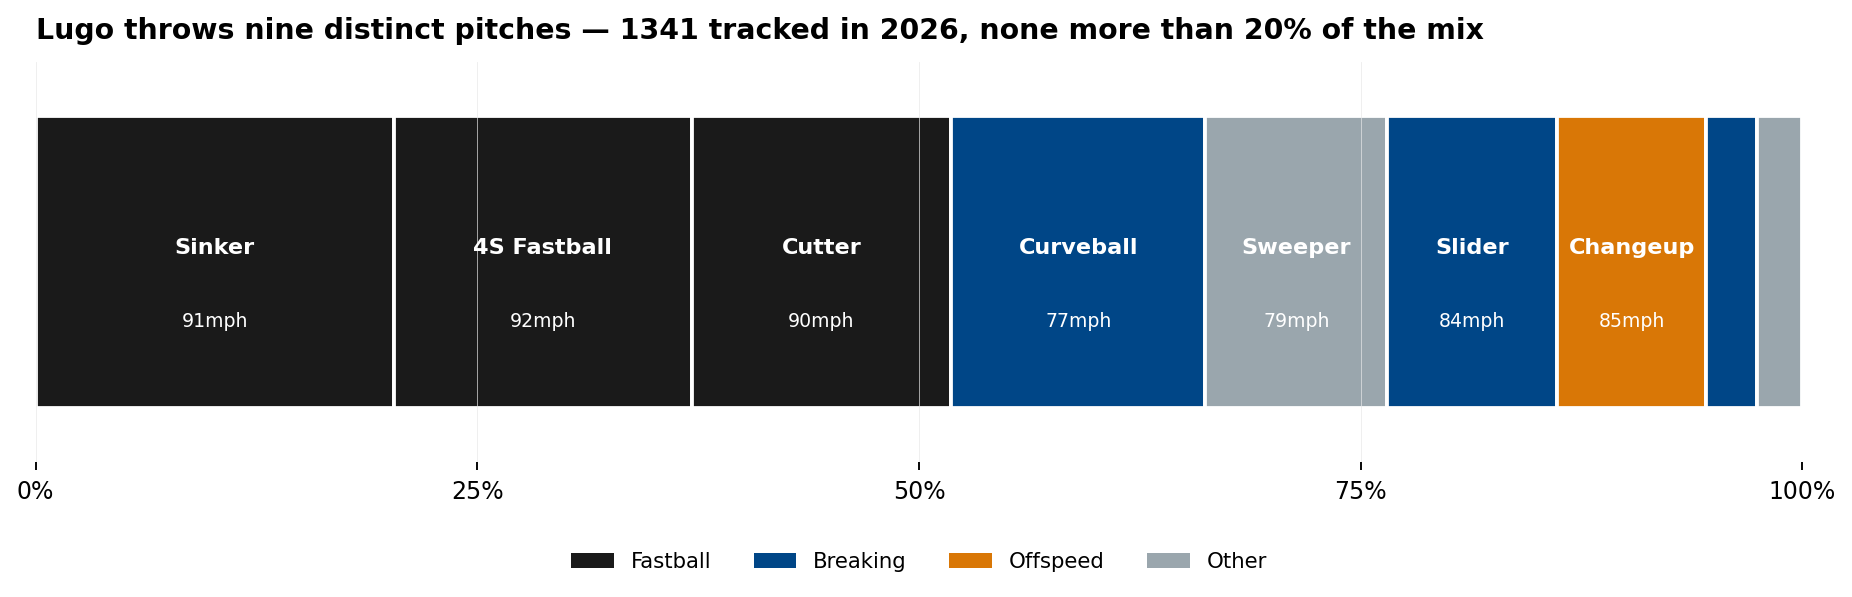
Nine pitches.
That is where any honest look at Seth Lugo has to start, because it is what makes him unusual. Most starters live on three or four offerings. Lugo threw nine distinct pitch types in 2026 — sinker, four-seamer, cutter, curveball, sweeper, slider, changeup, slurve, slow curve — and no single one accounts for even a fifth of his mix. He is not a power arm picking you apart with one elite weapon; he is a junkballer in the most literal sense, changing speeds and shapes so a hitter rarely sees the same look twice.
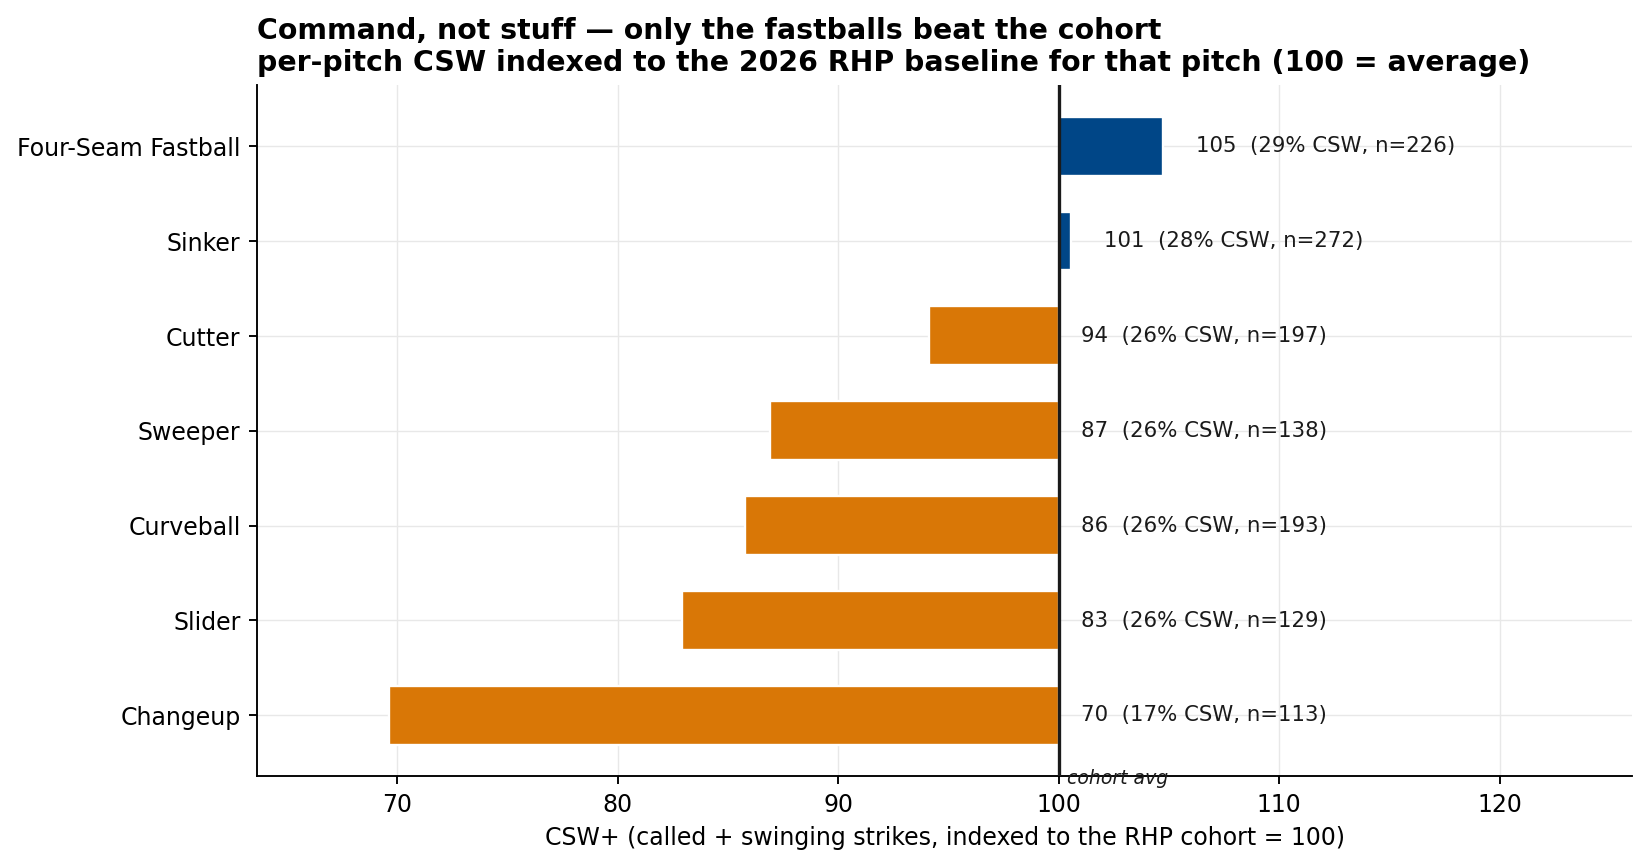
Command, not stuff
Variety is a means, not an end. The reflex is to ask which of the nine is the put-away pitch — and the surprising answer is that, measured properly, none of them is. Take CSW% (called-plus-swinging strikes, the standard whiff-and-take measure of a pitch’s stuff) and index each of Lugo’s pitches to the 2026 right-handed cohort throwing that same pitch. A score of 100 is exactly average for the pitch type.
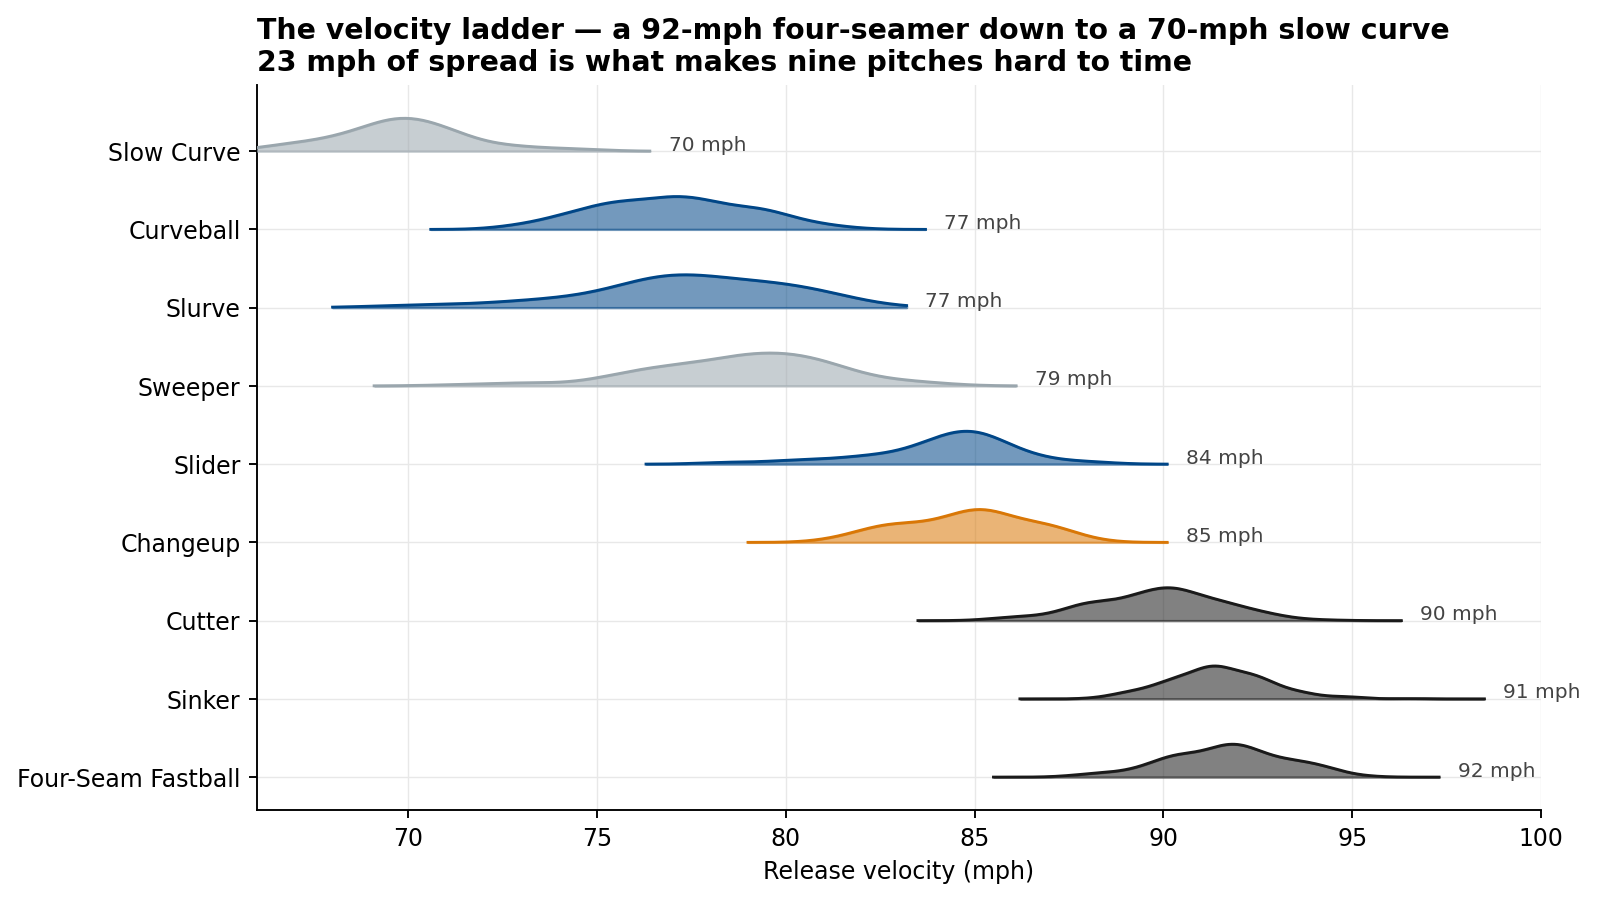
The mechanism behind that is the velocity ladder. Lugo’s arsenal runs from a 92-mph four-seamer down to a 70-mph slow curve — 23 mph of separation, delivered from the same arm slot, so the hitter is timing a moving target across nearly the entire range a major-league bat has to cover.
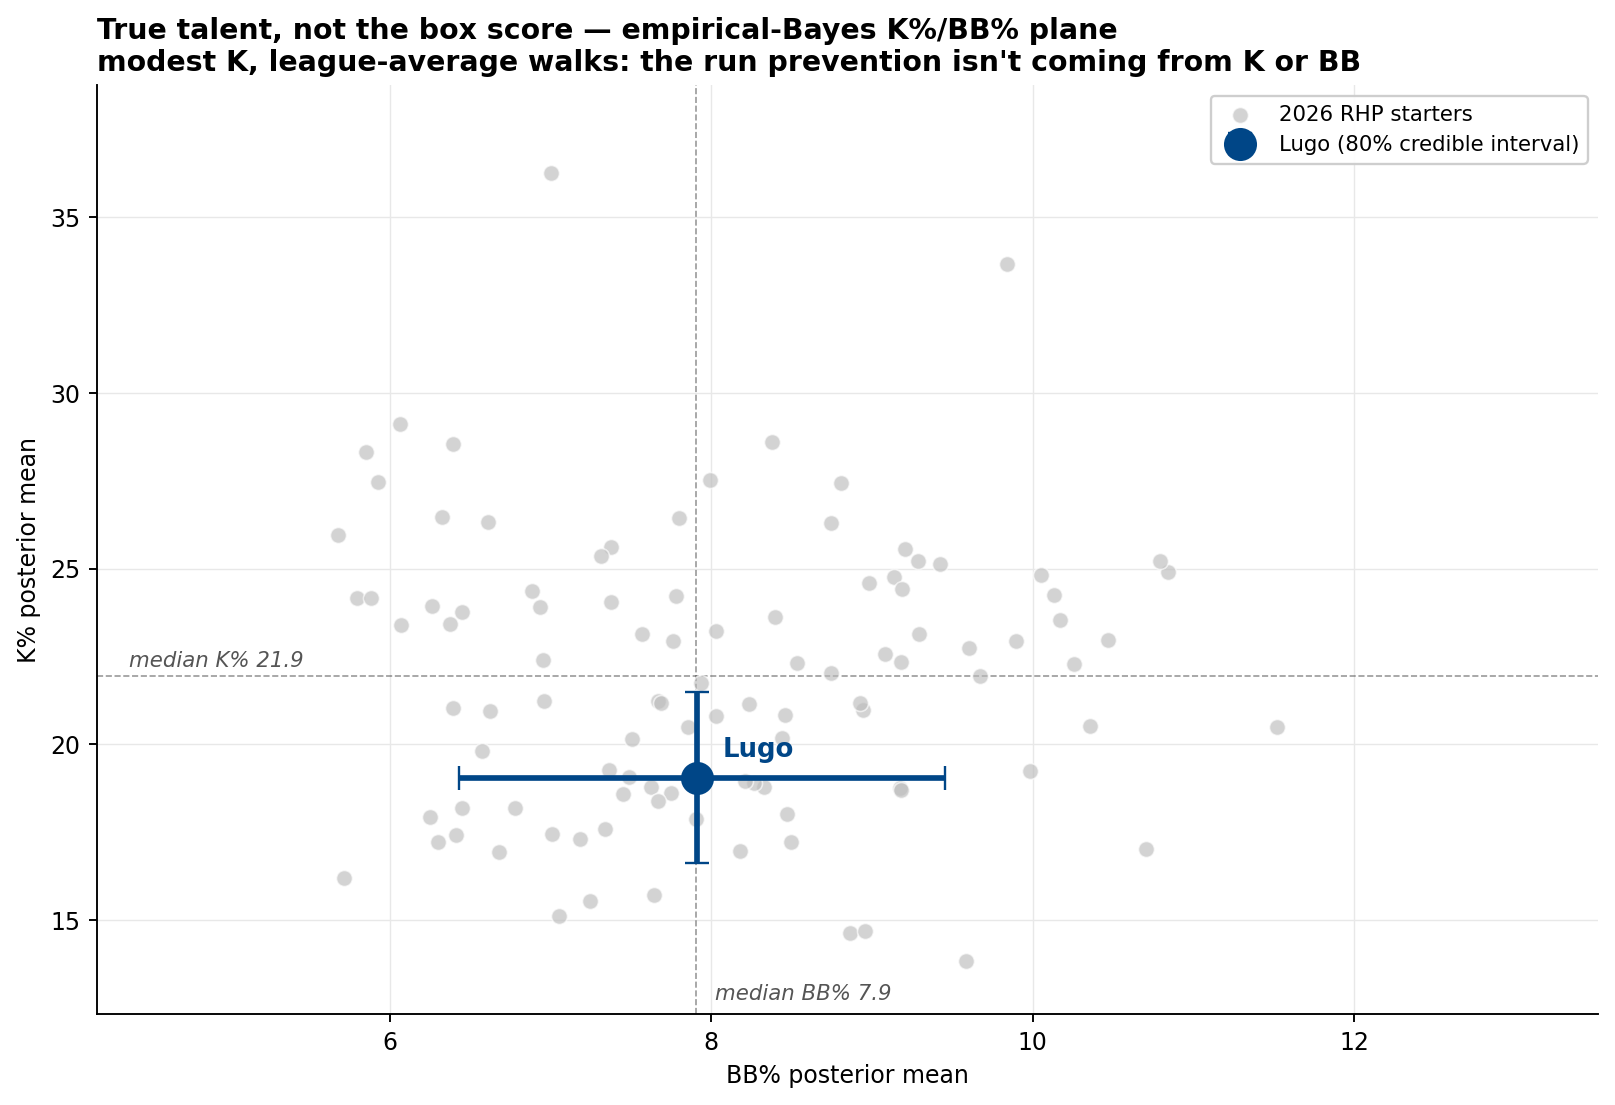
True talent, not the box score
Eighty-five innings is enough to notice a pitcher; it is not enough to know him. The fix is the same empirical-Bayes machinery this column uses for every small-sample case: write down what the population of 2026 RHP starters looks like, then update it with Lugo’s line. Fit a Beta prior to the cohort’s strikeout and walk rates and pull his posterior, and the verdict is clear — and a little deflating for anyone expecting a frontline arm.
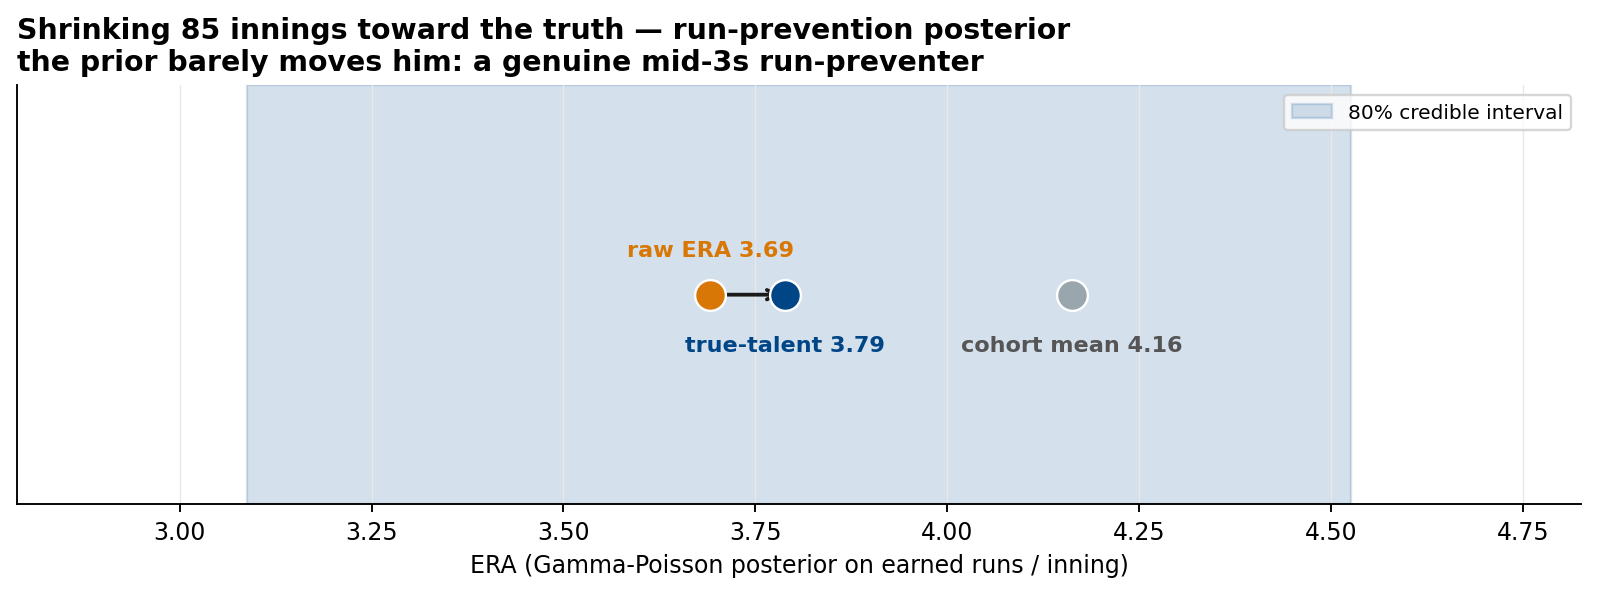
So where does the run prevention come from? The same Bayesian treatment, applied to runs allowed, answers it. Model his earned runs as a Gamma-Poisson process and shrink the 85-inning rate toward the cohort’s, and Lugo’s true-talent ERA lands at 3.79, with an 80% credible interval of 3.09–4.53. The prior barely pulls him — his raw 3.69 was not a mirage. Pair that with genuinely excellent home-run suppression (0.74 per nine, among the best in the cohort) and the picture resolves: Lugo is a contact-and-homer manager, a real mid-3s run-preventer whose value lives in the quality of contact he allows rather than the strikeouts he doesn’t.
The hole he plugs
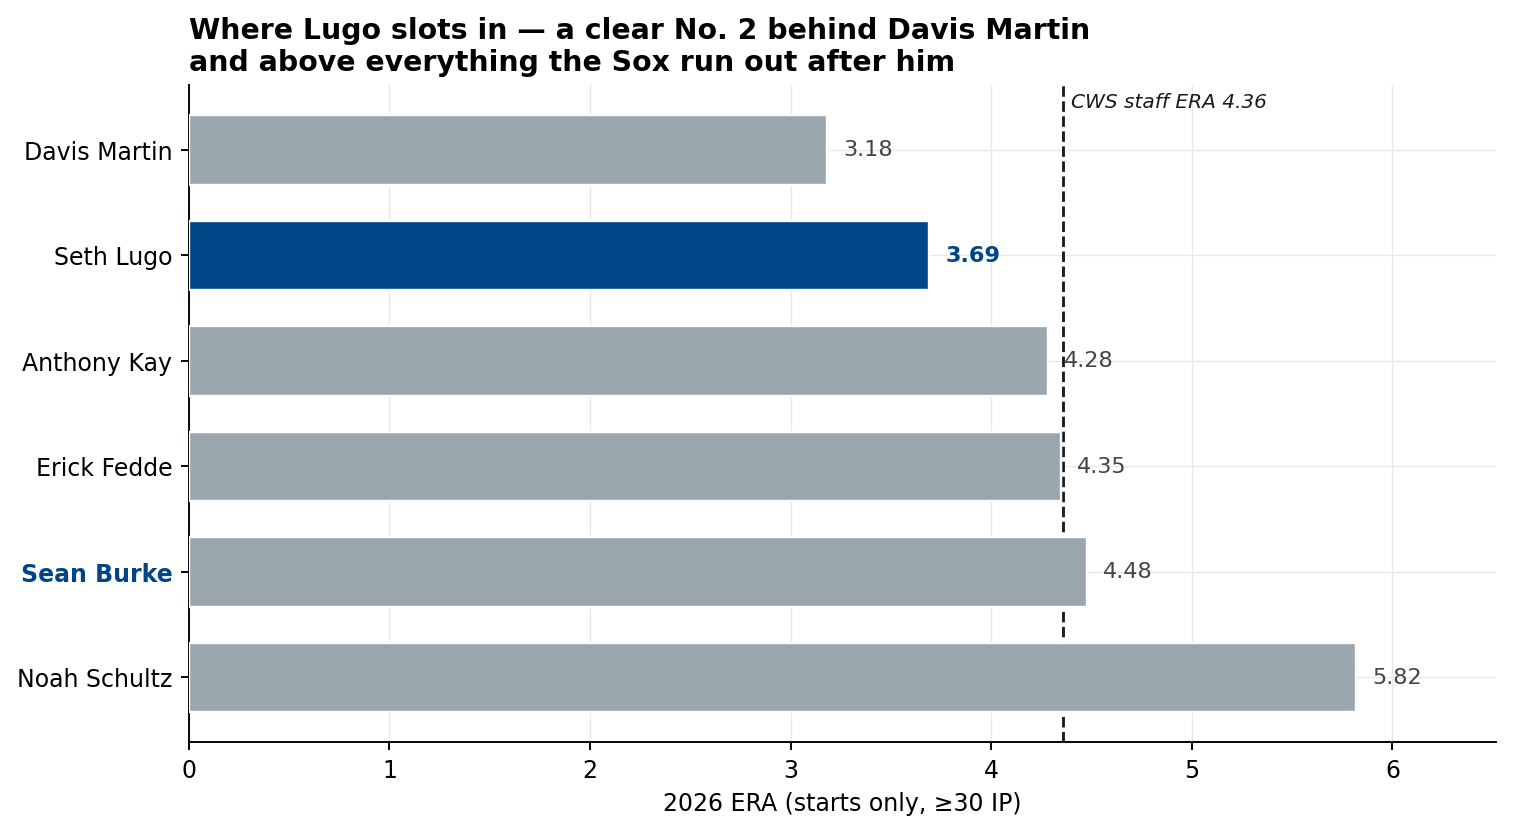
The White Sox rotation is one great start and a long drop. Davis Martin has been a front-line arm at a 3.18 ERA. After him the floor gives way: Anthony Kay 4.28, Erick Fedde 4.35, Sean Burke 4.48, and Noah Schultz struggling at 5.82, against a staff mark of 4.36. Drop Lugo into that group and he is immediately the second-best starter on the team — and he pushes the worst arm out of the rotation entirely.
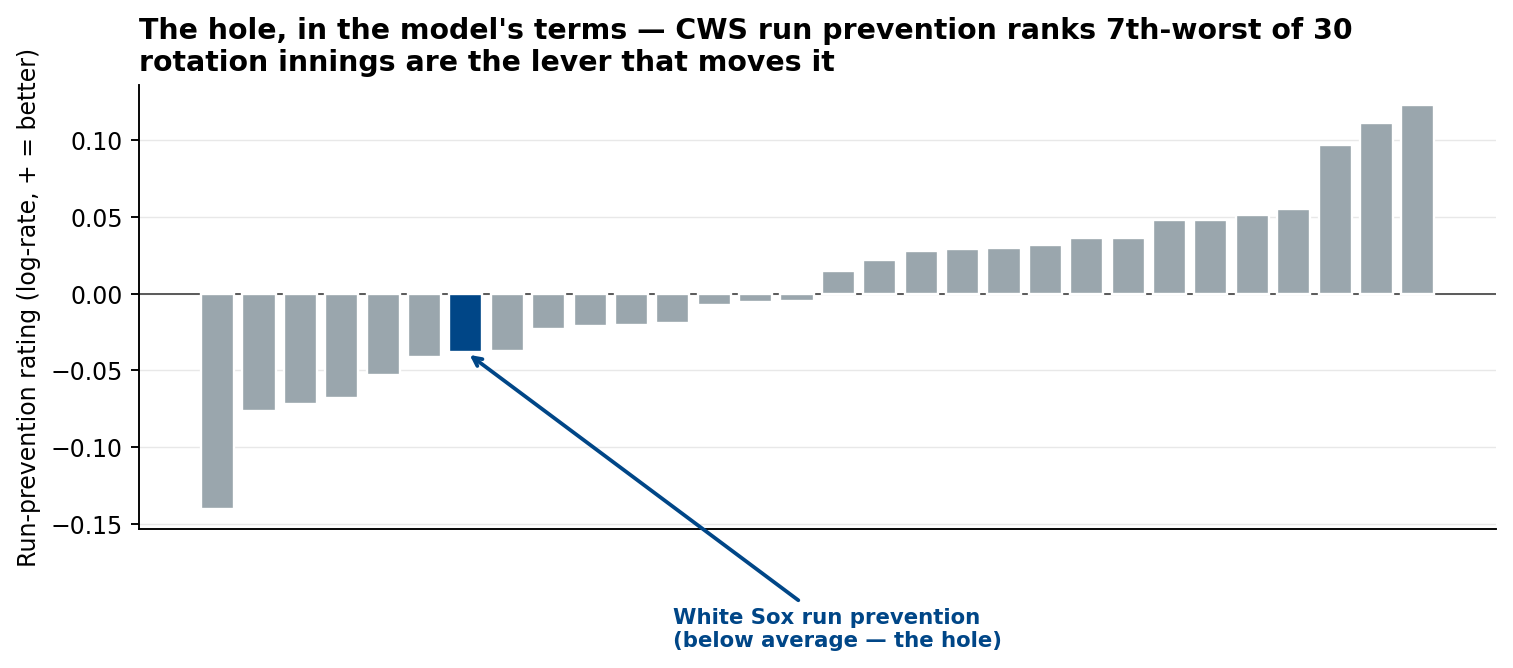
The model sees the same hole from the other side. Its team ratings split a club into run-scoring and run-prevention; Chicago’s run-prevention number is the seventh-worst in baseball — the structural weakness behind a contender’s record, and the rating most directly moved by adding quality starter innings.
The race he’d be joining
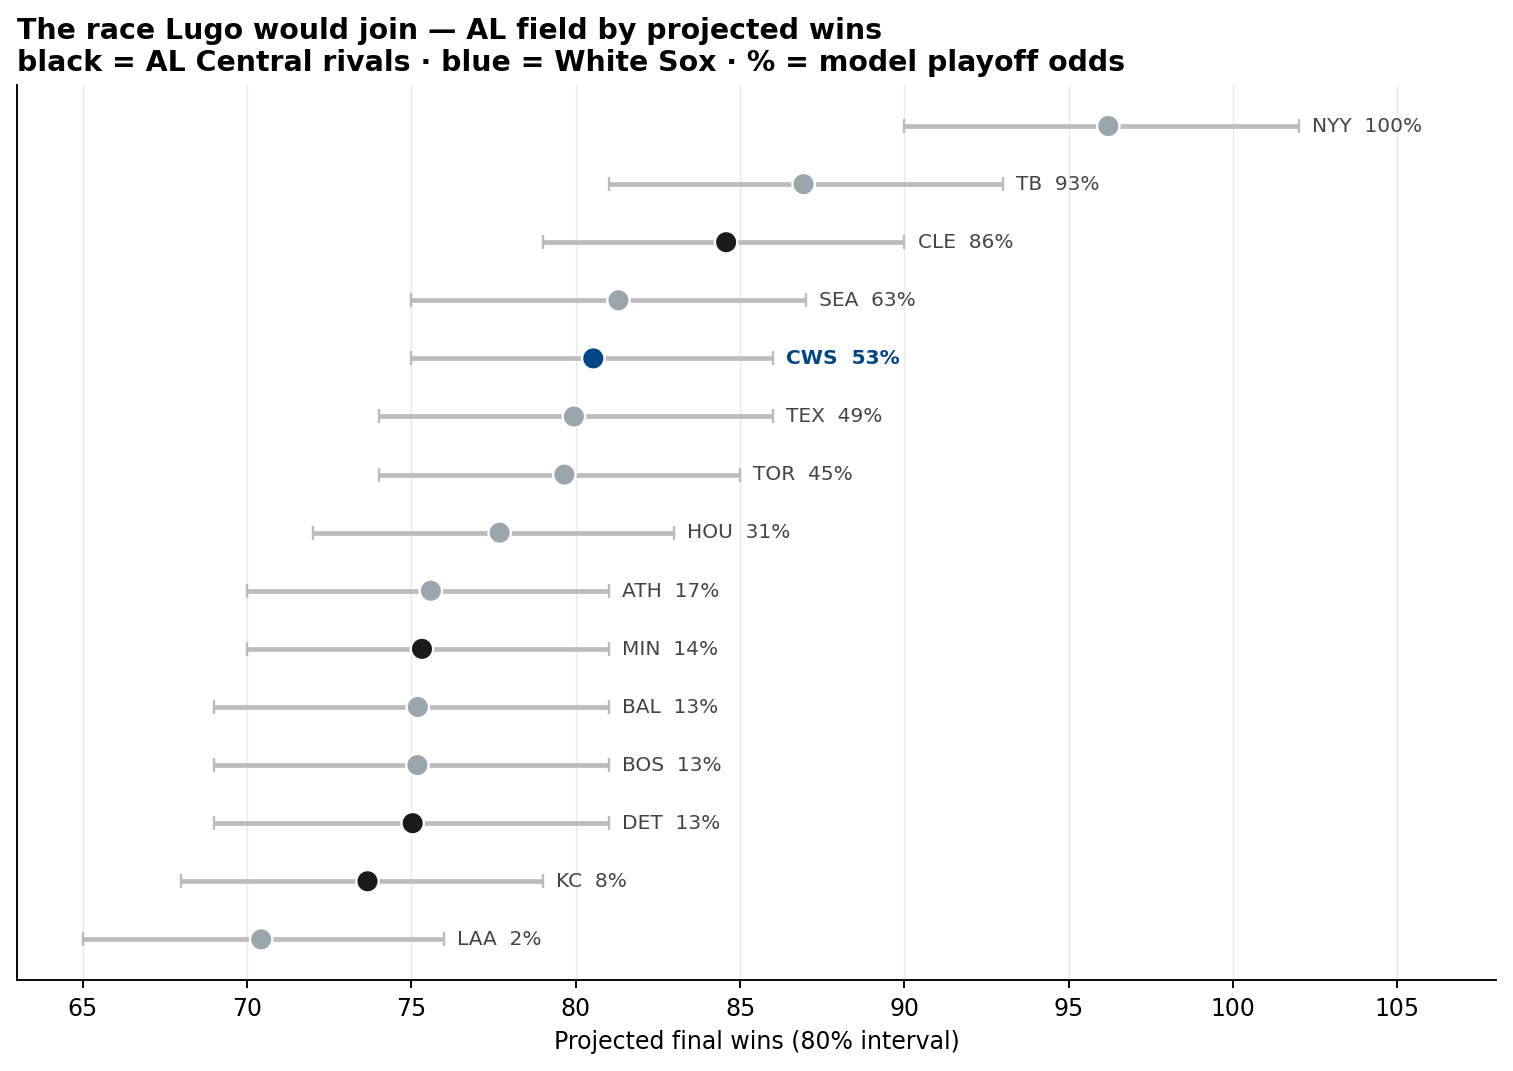
The AL Central has one runaway leader in Cleveland (86% to reach October) and then a gap. Chicago is the clear second team at 53%, holding off Detroit and Minnesota in the low teens, while the Royals sit at the bottom at 8% — the sellers. The Lugo trade is the second-best team in the division buying from the worst: an intra-division deal, with everything that implies for the asking price.
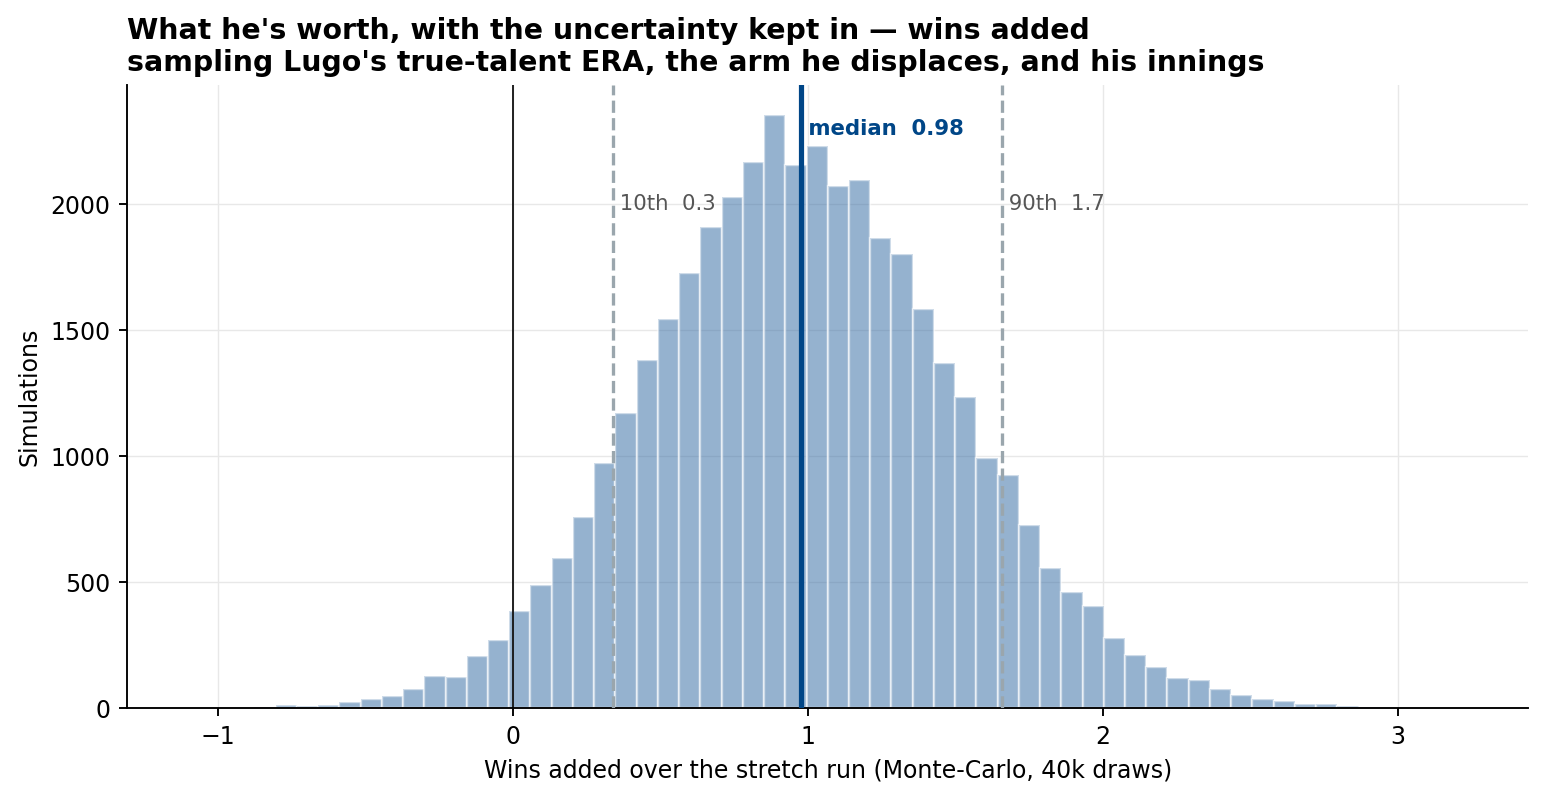
What he’s worth, with the uncertainty kept in
Now value the upgrade properly — not with a single point estimate but by propagating what we don’t know. A deadline starter makes roughly eleven starts down the stretch, about 63 innings. Run a Monte-Carlo that draws, for each of 40,000 simulated seasons, Lugo’s true-talent ERA from his posterior, the ERA of the back-end arm he replaces from a distribution centred near 5.2, and his innings from a realistic spread — then convert runs saved to wins at the standard ten-runs-per-win. The result is a median of 0.98 wins added, with an 80% interval of 0.3 to 1.7, and a thin tail where he barely beats replacement at all.
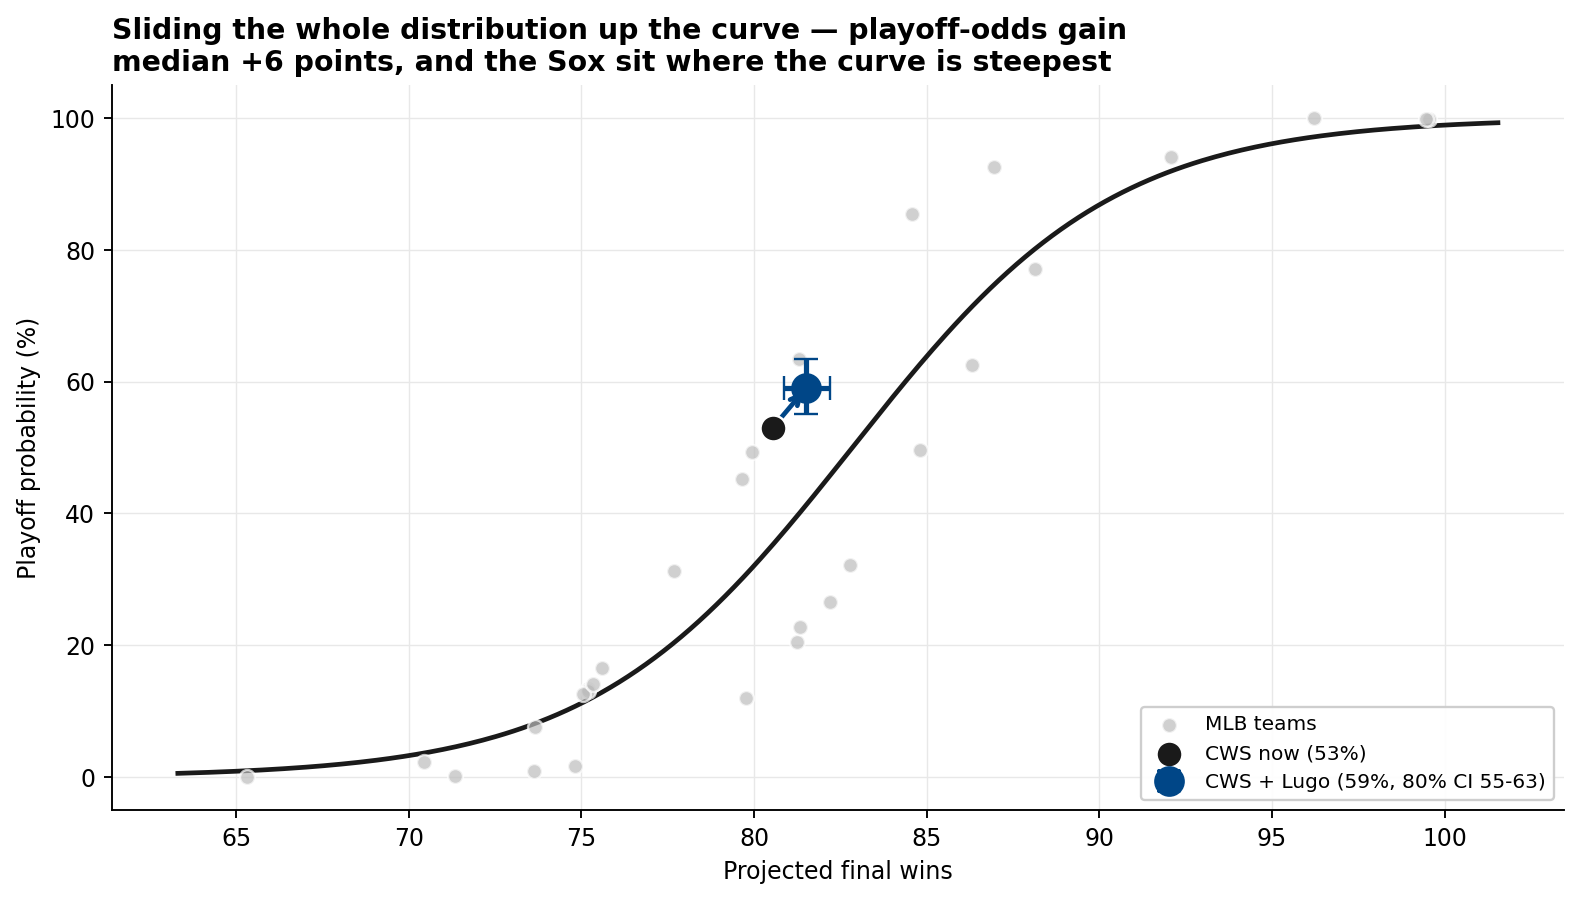
One win does not sound like much until you see where the Sox are standing. Fit a logistic of playoff probability on projected wins across all thirty clubs and Chicago sits on its steepest stretch — the part where a single win moves the odds most. Slide the entire win distribution along that curve and their October probability rises from 53% to a median of 59%, with an 80% interval of 55–63%.
So how far up the board do you go?
Here is the question the rumour only asserts an answer to. Turn the wins into money and compare them to what a prospect is worth. A marginal win trades for roughly $8M on the open market, so Lugo’s median win as a pure rental is worth about $8M in win-value (the 80% interval runs $3–13M). If he comes with a year of control rather than as a rental, add a full 2027 at a conservative two wins and the gross win-value rises to about $24M.
Prospects have a published price too. The industry-standard valuation scale maps a prospect’s Future-Value grade to surplus dollars: a 40 FV (roughly an organisation’s top-ten-but-outside-the-top-100 bat, which is what Colby Shelton and Javier Mogollón are) is worth around $7M; a 45 FV (a back-end top-100 name, an org’s top-three or -four piece) around $20M; a 50 FV around $40M. Lay Lugo’s win-value across that curve and the breakeven falls out.
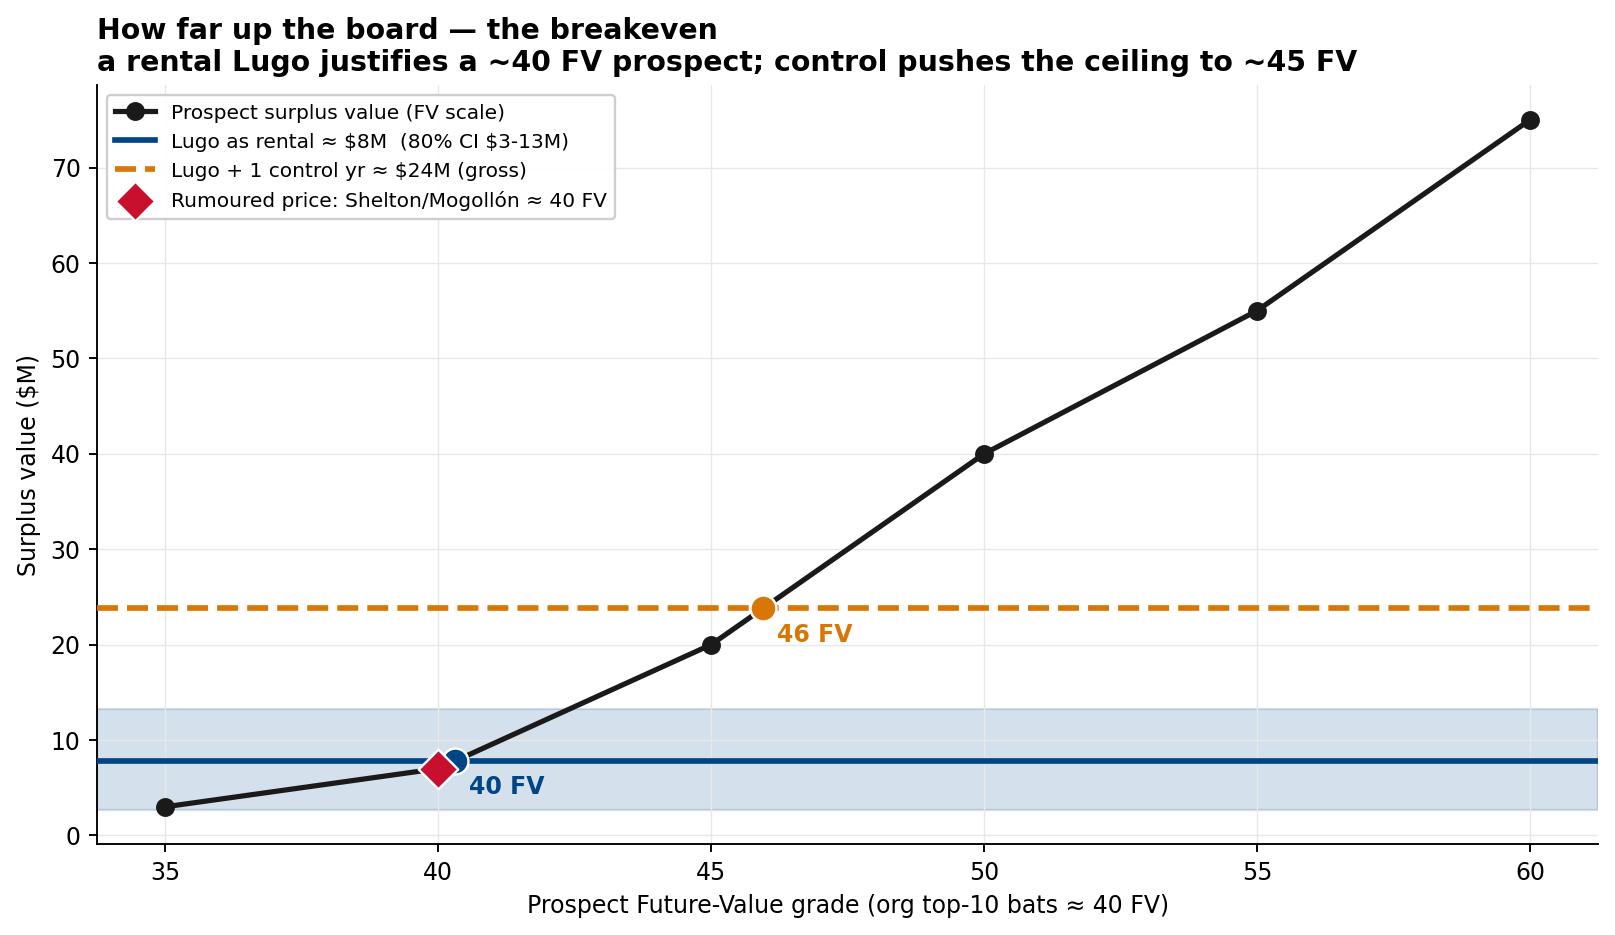
So the math endorses the rumour, and bounds it. For a pure rental, a Shelton- or Mogollón-tier prospect (≈40 FV) is fair value — pay it without much hesitation, but do not go past it; a 45-FV piece for a half-season rental is overpaying. If Lugo carries a year of control, the ceiling moves up to roughly a 45-FV prospect — an org’s top-three or -four name — and no further. What you do not do in either case is surrender a top-100-overall, top-of-the-org piece: his modest strikeout rate caps how much he can carry a short October series, and the surplus simply isn’t there above 50 FV. The intra-division wrinkle pushes Kansas City’s ask up — they have no reason to hand a chasing rival a discount — but it does not change what the wins are worth to Chicago, which is the only number that should set their walk-away.
What this tells us
Seth Lugo is exactly the kind of acquisition that looks unspectacular and grades out well. He misses no bats, walks a league-average number, and his nine-pitch kit is the fingerprint of a pitcher surviving on craft rather than overpowering anyone — and yet the shrinkage confirms a genuine mid-3s run-preventer who would walk into Chicago as its second-best starter and plug the one hole on a contender. About a win down the stretch, a median six points of playoff probability because of where the Sox sit on the curve, and a clean answer to how far to go: a 40-FV prospect for a rental, up to a 45 for a controllable year, and not a name beyond that. The rumour had the price about right. The math just shows why.
Method. Lugo’s arsenal, per-pitch CSW (called +
swinging strikes, including foul tips and blocked swinging strikes) and
velocities come from the 2026 pitch-level data; CSW+ indexes each pitch to
the season’s RHP cohort for that pitch type. Rate stats and the
cohort of 103 qualified RHP starters (≥8 GS, ≥40 IP) come from the
per-appearance game logs. True-talent K% and BB% use empirical-Bayes Beta
priors fit by method of moments to the cohort and updated via the
Beta-Binomial conjugate (80% credible intervals from posterior Beta
quantiles); run prevention uses a Gamma-Poisson posterior on earned runs
per inning with the prior fit to the cohort’s rates. Wins added are a
40,000-draw Monte-Carlo sampling Lugo’s ERA posterior, the displaced
arm’s ERA (Normal, mean 5.2), and his innings (Normal, ~11 starts),
converted at ten runs per win; the playoff-odds swing slides that
distribution along a logistic of model playoff probability on projected
wins (all 30 clubs), anchored at the Sox’s actual model odds.
Surplus value uses $8M per marginal win and the published prospect
Future-Value-to-dollars scale; FV grades, prospect names and rankings are
external (the cited trade report and industry valuation framework), not
model outputs. Run-prevention ratings and playoff odds are the
model’s own (team_strength, standings_sim).
Figures reflect data through 2026-06-25.