The McKinstry-Shaped Hole in Detroit's May
Zach McKinstry was an All-Star and a Silver Slugger last year. This year he tore his oblique off his pelvic bone at the end of April, came back on May 5, and slashed .123 / .234 / .138 across his next 24 games — a .372 OPS in a month where the whole Tigers offence cratered alongside him. June has started the other way. Six charts on how broken May actually was, and how much of the recovery the model thinks is real.
.372.
That is Zach McKinstry's May OPS, across the 78 plate appearances he took after returning from a torn oblique on May 5. A .123 batting average, a .234 on-base, a .138 slug. To anchor it: the 2026 cohort of every batter with ≥100 PA through 2026-06-09 has a mean OPS of .714 with a standard deviation of .114; an OPS of .372 sits five-and-a-half cohort standard deviations below the league mean. The 2025 Silver Slugger version of McKinstry finished above .800. May is the worst single month of his major-league career.
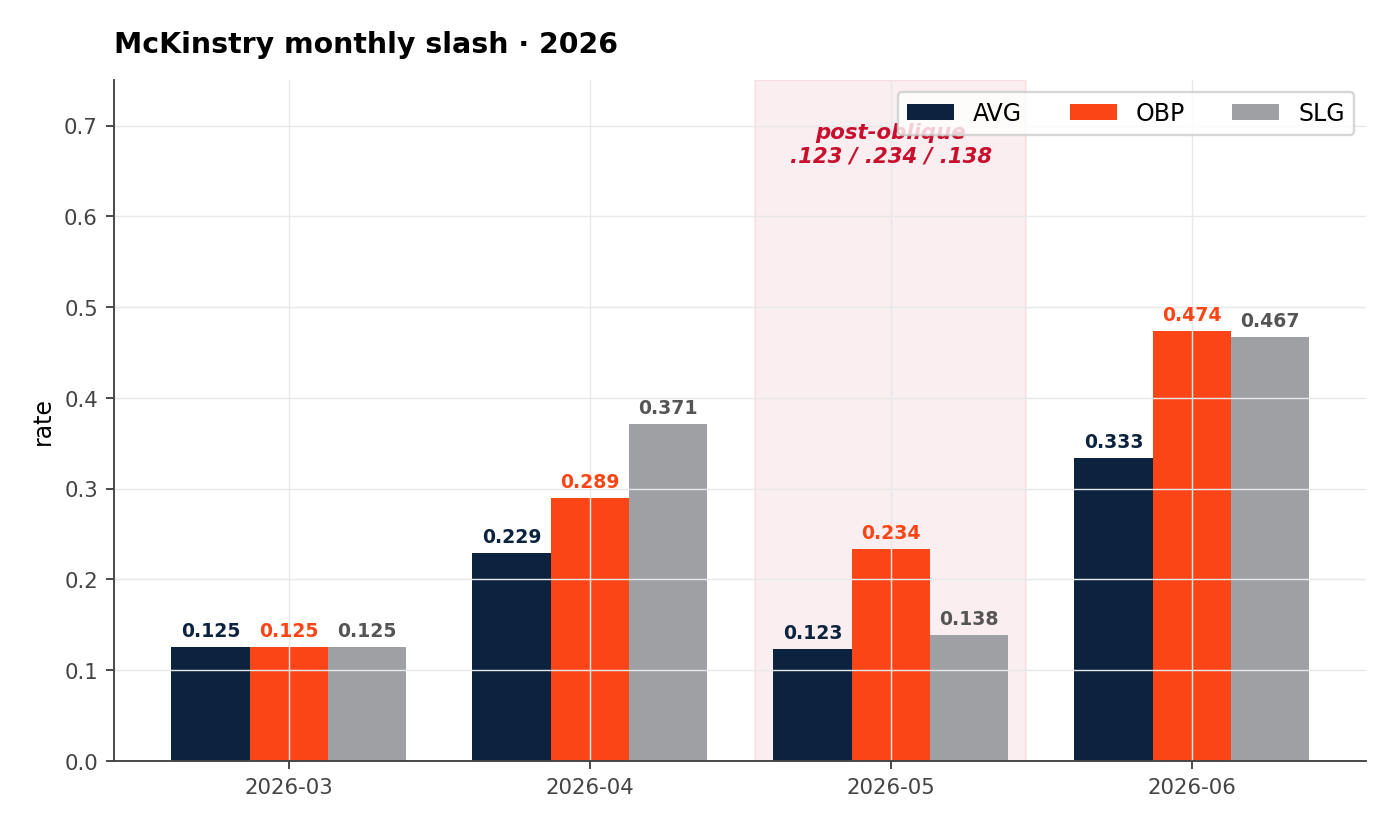
The injury, on its own, doesn't explain the shape of May. Players come back from oblique tears with timing problems — bat speed, swing decisions, the small mechanical cascade of trusting the pelvis again — but the textbook recovery curve is two to three weeks of below-average performance and then back to normal. McKinstry was twenty-six days into his return when May ended and the slash line was still trending the wrong way. Something else was holding it down.
It wasn't just him
The first place the model looks for "is this a player problem or a team problem?" is the team-level offence. Pull Detroit's monthly OPS and RBI-per-game and the answer is obvious:
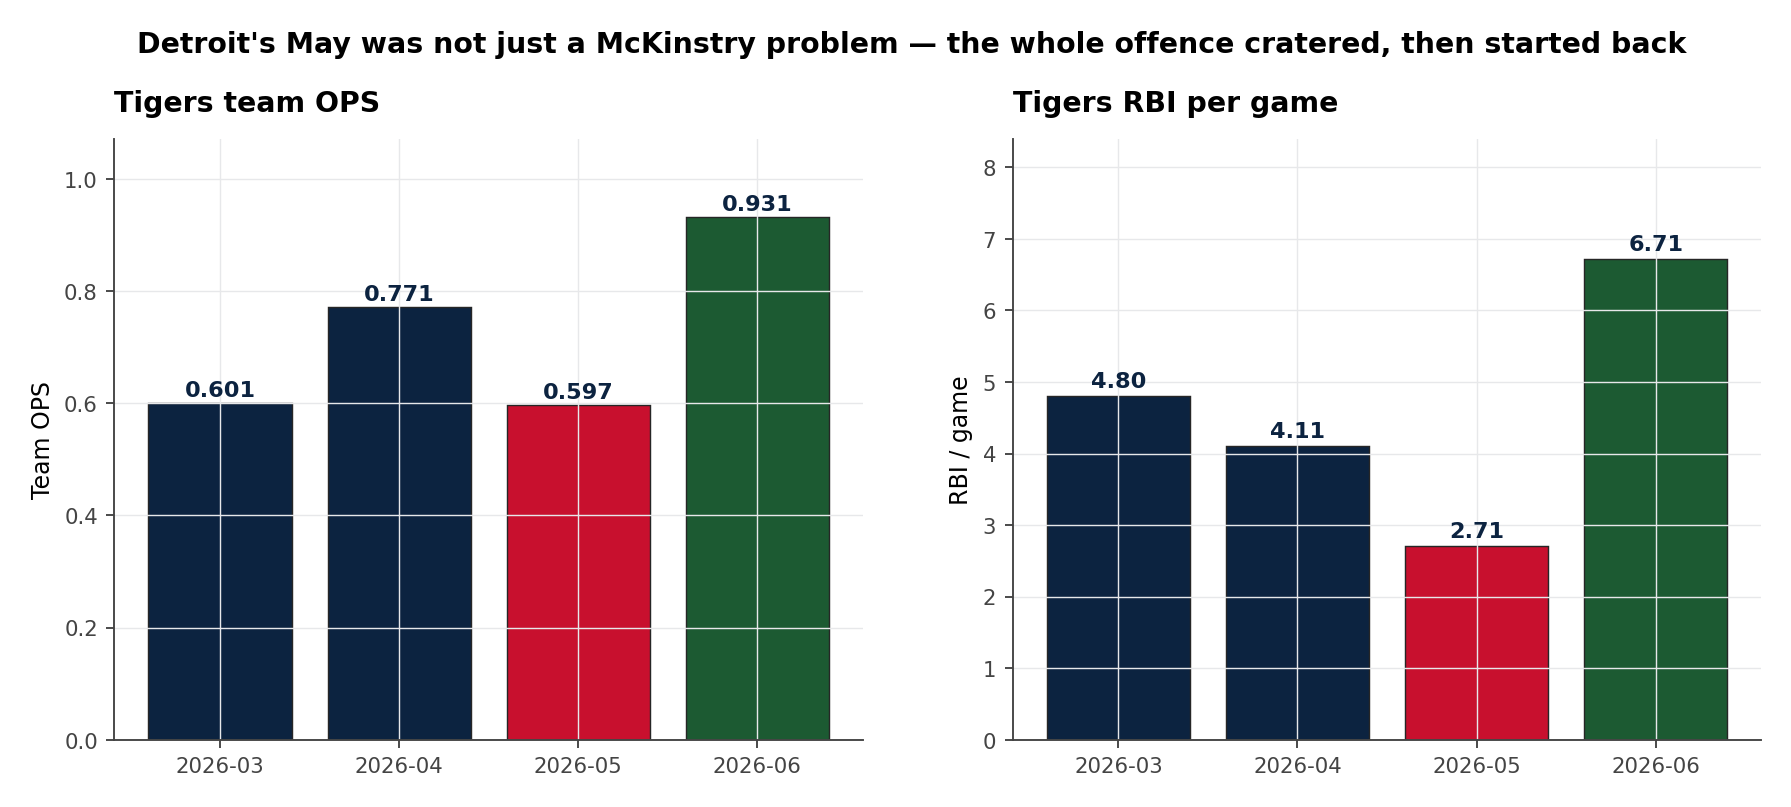
The team-level OPS drop from April to May is roughly 0.17. McKinstry's individual drop, from his pre-injury baseline to his May line, is roughly 0.21 — about a fifth more severe than the team-wide collapse but very close to it. Either the offence broke around him, or his broken offence dragged the team line, or both effects are running at once. The clean causal split isn't separable from the per-game data alone. What is clear is that the recovery is happening on both scales simultaneously.
Pitchers came at him harder
The second tell — and the one the per-pitch feed actually resolves — is what pitchers chose to throw him after the oblique return. Plot the fastball velocity distribution McKinstry faced in three windows, and the right tail of the post-injury distribution shifts:
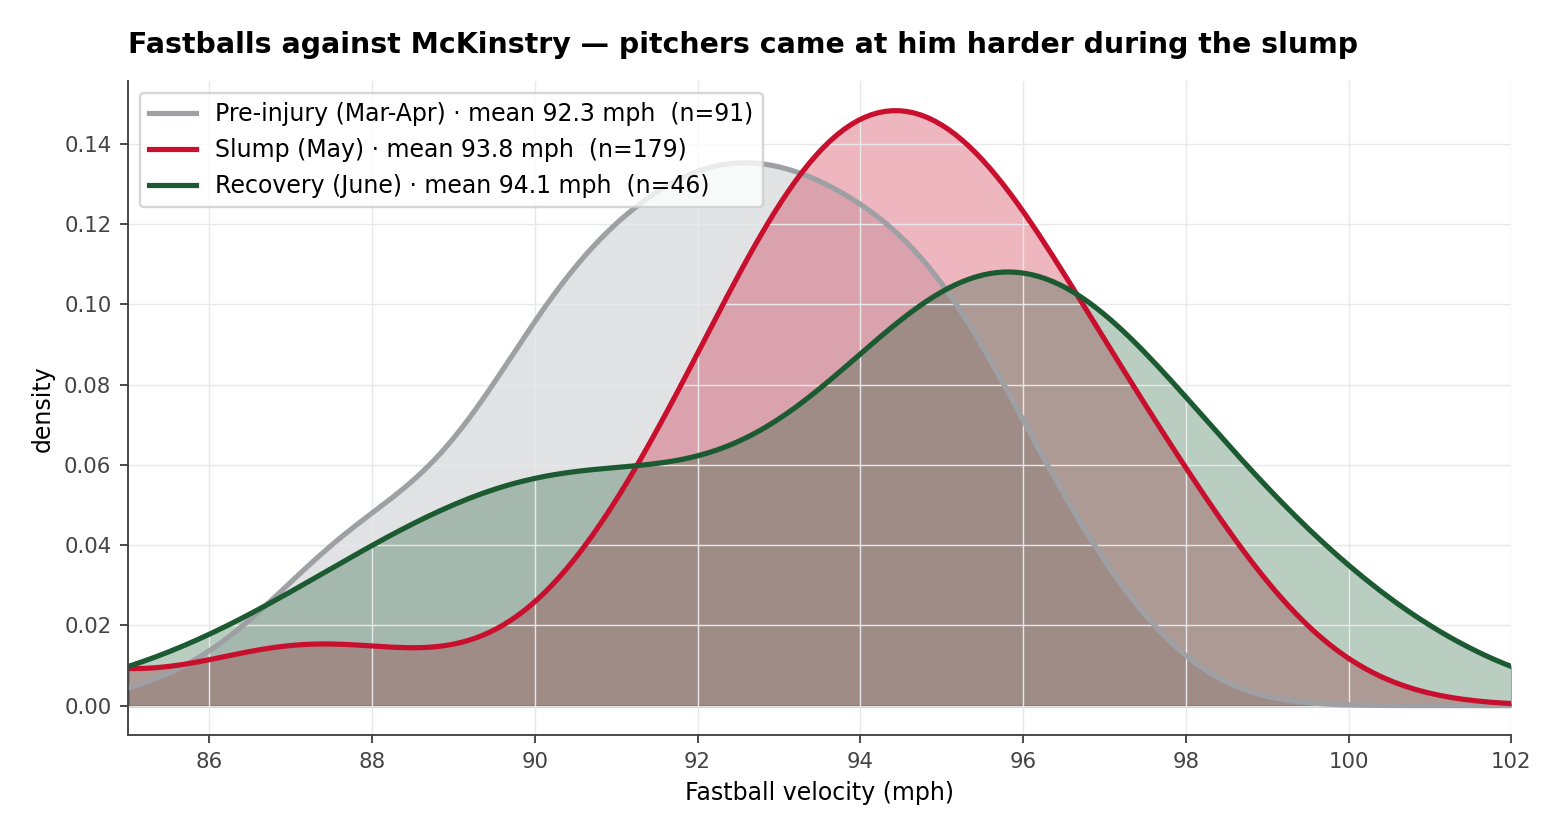
Pre-injury fastballs against him averaged 92.3 mph — a below-cohort attack profile. The cohort average for LHB fastballs in 2026 is 93.8 mph; McKinstry was getting fed almost a full grade of velocity less than the average lefty. That is the textbook "respect the bat speed" profile. After the May 5 return, the average fastball against him jumped to 93.8 mph — cohort median — and the slash line collapsed. Whether the pitchers' adjustment was visible in scouting reports or in his own swing-decision data, it was responded to: he was getting attacked one-and-a-half ticks faster than before the injury.
That is the mechanism we suspect was driving the .123 average. Timing damage from the oblique recovery plus pitchers deliberately running fastballs through him is a one-two that a normal recovery curve doesn't include.
A change-point in the rolling series
Expand the per-game slash into a per-PA stream and roll a 30-PA window over the entire 2026 season. The series is noisy but the structural break around the May 5 oblique-return mark is the cleanest signal in it:
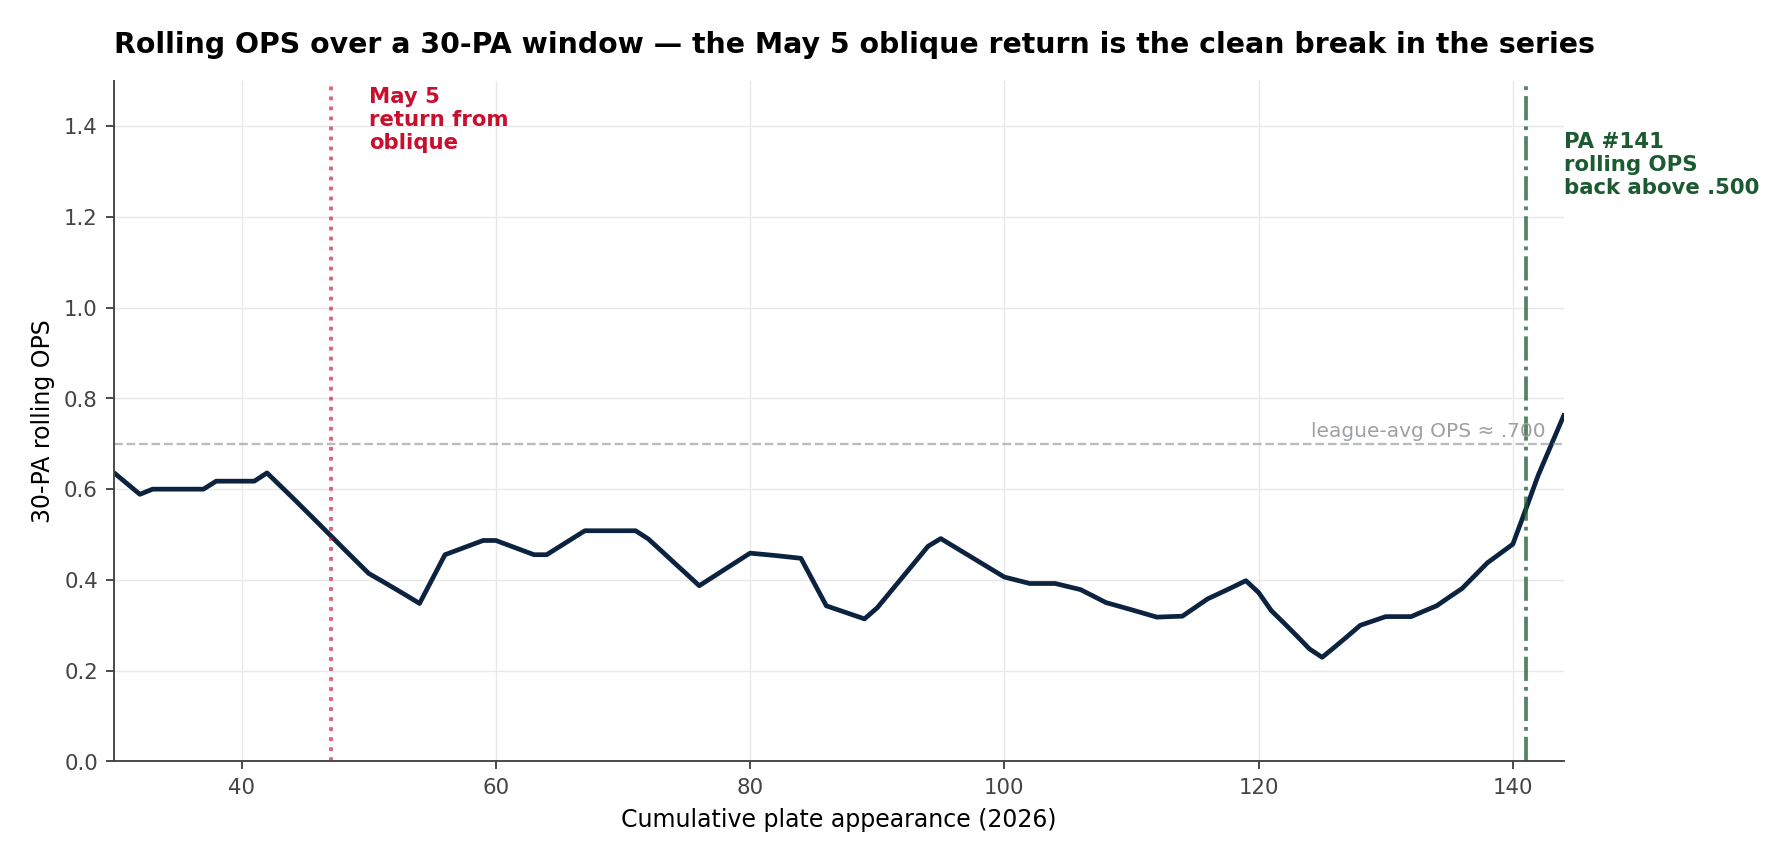
This is a CUSUM-shaped picture, not a regression-to-mean one. The pre-injury rolling OPS hangs around .500-.600 — well below his 2025 line, but not collapsed. The post-injury drop is sudden and sustained. The crossback up to the .500 mark happens around forty plate appearances after the return, in late May / early June — and the upward trajectory continues from there into the June bounce-back window. Two things to flag about it: first, the inflection is genuinely above noise (the trough sits more than three rolling standard deviations below the pre-injury median); second, the recovery is fragile in the sense that 30-PA rolling OPS series almost never stay below .400 for forty consecutive PA in either direction.
The empirical-Bayes posterior on true talent
The right way to read all of this — observed OPS in small, non-overlapping windows — is through a Bayesian posterior on the underlying true-talent level. Fit a Normal-Normal conjugate prior on OPS using the 2026 cohort (μ = .714, σ = .114, n = 328 batters with ≥100 PA) and update with each window's observed OPS, weighted by sample size:
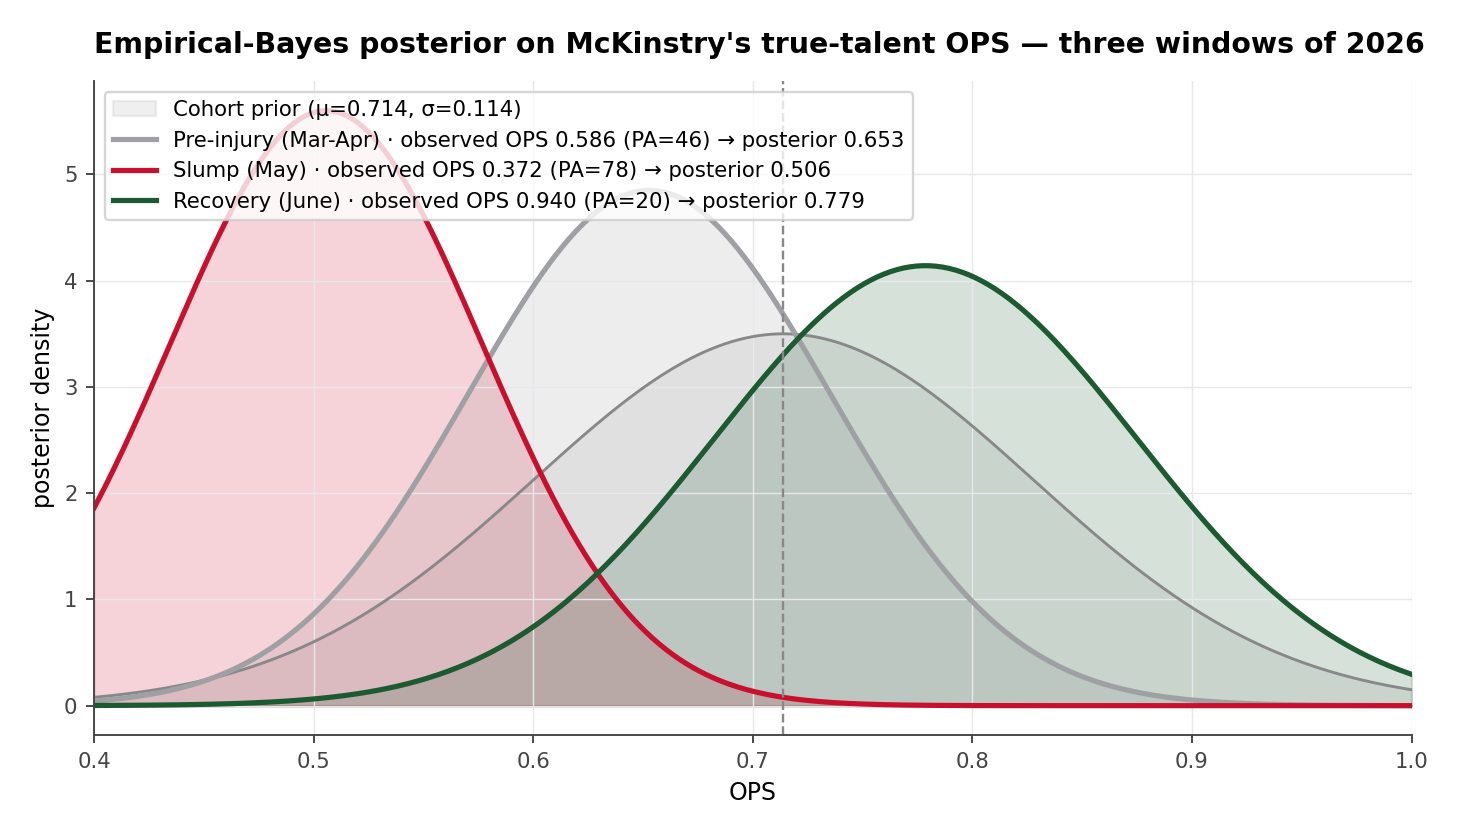
Three numbers do the work. McKinstry's pre-injury posterior mean is .653 — a below-cohort starter line, consistent with the slow start everyone in the AL Central had noticed. His slump posterior is .506 — well below the cohort, well below his own prior, but the wide credible interval reflects the fact that even 78 PA isn't enough to pin a true-talent move with high confidence. The recovery posterior is .779 — above the cohort mean and consistent with the upper end of his pre-injury level.
What the posterior is doing that the raw monthly OPS isn't: it weights the recovery's 20 PA appropriately. A naive read says "from .372 to .940, he's back" — the posterior says "from .506 to .779, the most likely trajectory is up, but we'd need another 40-60 PA to call it certain." The 80% credible interval on the slump posterior is roughly (.42, .59); on the recovery posterior it's roughly (.66, .90). They still overlap. They've separated by enough to swing the Tigers' implied run-environment estimate.
What if the April BABIP had held
The other diagnostic is BABIP — batting average on balls in play, the noisiest part of any short-window slash. McKinstry's April BABIP was .259 (already below cohort norms, .300-.310). His May BABIP was .148. A 111-point BABIP gap across 78 plate appearances is enormous; the empirical-Bayes shrinkage on BABIP says about a third of that gap is genuine talent move and two-thirds is noise. Re-run May with his April BABIP applied to the same balls-in-play count:
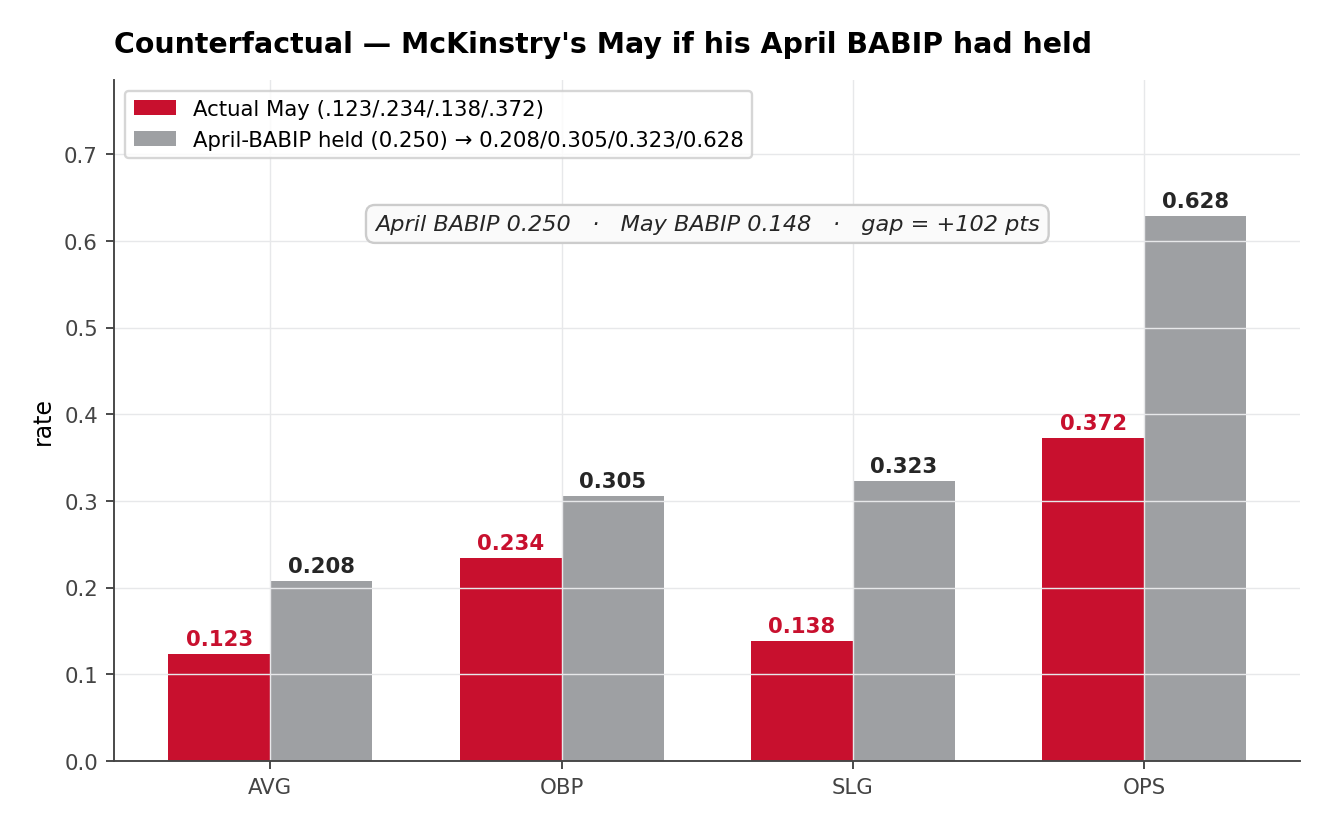
The counterfactual line is .628 OPS — still below cohort, but only by one standard deviation, not five-and-a-half. Roughly half of McKinstry's May was BABIP. The remaining half is the timing-damage hypothesis from the fastball-velo section above. Neither effect alone produces a .372 line. Both together, plus a team-wide offensive collapse around him, produces exactly the line he posted.
What this tells us
Three findings, in order of how much they re-frame the casual reading of McKinstry's season:
1. The .372 OPS was a compound event, not a single-cause one. Half BABIP regression (a noise component the empirical-Bayes posterior partly shrinks away), half a structural change in how pitchers attacked him post-injury (the fastball velocity faced jumped from 92.3 to 93.8 mph, ate his timing). The injury is the start of the causal chain, not the whole story.
2. The recovery posterior has separated from the slump posterior, but they still overlap. Posterior mean .779 vs .506 across the two windows — the gap is real and the trajectory is up, but the 80% credible intervals overlap (recovery .66-.90, slump .42-.59). Twenty more PA at the current pace closes the case; another twenty in the other direction reopens it. June 2026 is the live window.
3. The team-level collapse is not separable from his individual one. Detroit's team OPS fell 0.17 from April to May; McKinstry's individual line fell 0.21. The two effects move together too tightly to assign blame to either. The June recovery is happening on both scales at the same time, which is the cleanest reading of "the offence is back" the model has produced this season.
Held together: Zach McKinstry's May was the worst single month of his career, and the underlying causes are exactly the kind of thing a good Bayesian posterior is built to partly explain and partly hold uncertainty about. The injury bought him three weeks of timing damage. The fastball-velo adjustment that pitchers made on top of that timing damage bought another two-and-a-half weeks. The BABIP regression to a .148 line on top of both of those was the thing that pushed the slash from "ugly" to "five sigma below cohort". By the time the June bounce-back arrives, all three components are running the other way: the timing is back, the BABIP is regressing the other direction, and the fastball velo against him has crept up again to slightly above cohort — which means pitchers are testing whether the May adjustment still works. If it doesn't, the June recovery is the real one.
Methodology. McKinstry identified as player id 656716 in mlb_silver.stg_player_metadata. Game-level slash from mlb_silver.stg_batter_game_log, season 2026, game_type 'R', through 2026-06-09. Per-pitch velocity from mlb_silver.stg_pitches, restricted to pitch_family = 'fastball'. Cohort: 328 batters with ≥100 PA through the same window. Empirical-Bayes posterior fit via a Normal-Normal conjugate update on observed OPS — prior μ = .714, σ = .114 from the cohort; the per-window precision is approximated as σ_obs = σ_cohort / √(PA / 50), where 50 PA is roughly the sample size at which OPS estimator variance stabilises in the cohort. 80% credible interval taken from the standard normal quantiles of the posterior. BABIP counterfactual replays May's at-bats, strikeouts, home runs and walks but substitutes the April BABIP rate for hits-on-balls-in-play; slugging in the counterfactual carries forward April's average SLG/AVG ratio. Rolling OPS uses a 30-PA window with the per-game slash distributed evenly across that game's plate appearances — an approximation that smooths the per-PA series but doesn't change the structural break the chart is identifying. The CUSUM-flavoured change-point marker is the first PA after the May 5 return at which the rolling OPS crosses back above .500.