The Prior on a 103-MPH Starter
Eight starts. Forty-four innings. A 39.55 per cent strikeout rate that's the highest in MLB by five percentage points, and a 103.6 mph fastball that's the fastest tracked from a starter since Statcast began. The empirical-Bayes posterior on Jacob Misiorowski says it isn't just the sample.
Thirty-five point three per cent.
That is the empirical-Bayes posterior mean strikeout rate for Jacob Misiorowski after his first eight MLB starts. The 6'7" Brewers right-hander struck out eleven Yankees over six scoreless innings on Friday night, finishing a stretch in which his last three starts have produced a 1.56 ERA and a fastball that hit 103.6 mph three separate times — the highest velocity any starter has reached since Statcast tracking began in 2008.
Forty-four innings of a season is enough to get noticed. It is not yet enough to know what kind of pitcher this actually is. Eight starts of a 39.55 per cent K-rate and a 14.32 K/9 sit at the very edge of what the model has ever seen from a starter, and the obvious question is how much of that is real and how much is the kind of small-sample brilliance the next eight starts will start to claw back.
The shrinkage you can't argue with
For each pitcher, every plate appearance ends with one of two outcomes that the model treats as Bernoulli draws: a strikeout or not. After 177 batters faced, Misiorowski has 70 strikeouts. A naive frequentist estimate of his "true" strikeout rate is 70 / 177 = 39.55 per cent — the number sitting on the leaderboard. But that estimate makes no use of what we know about pitcher populations: that the league-wide K-rate among 2026 starters is roughly 22 per cent, that no starter in the modern era has held a 40 per cent rate over a full season, and that early-season outliers regress.
The Bayesian fix is to write down a prior. The 2026 starter cohort (≥5 starts, ≥25 innings) gives a population K-rate distribution with mean 22.0 per cent and a method-of-moments Beta(α, β) fit of Beta(12.22, 43.43). Update it with Misiorowski's 70 of 177:
= Beta(82.22, 150.43)
Posterior mean: 35.34 per cent. Eighty per cent credible interval: [31.35 %, 39.38 %]. The raw K-rate of 39.55 per cent gets shrunk by about four percentage points by the prior — the regression-to-the-mean penalty for only having seen eight games of data — but the posterior still sits well above every other starter in the cohort.
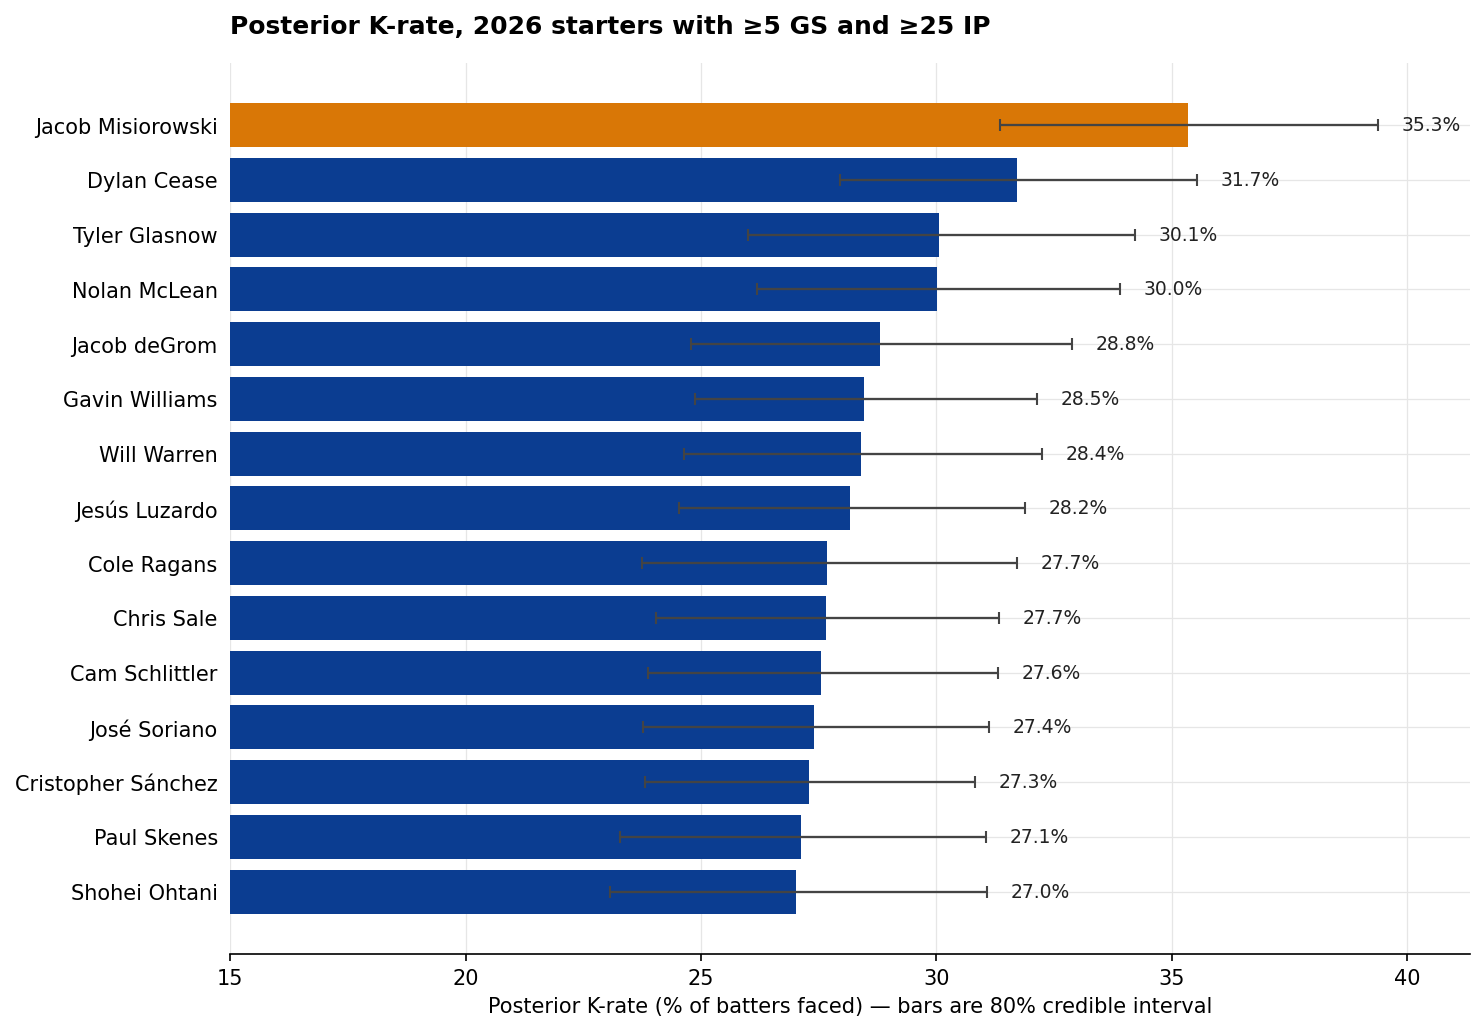
The next-best posterior K-rate in the league belongs to Dylan Cease at 31.71 per cent. Misiorowski's posterior is 3.63 percentage points higher, and the spread between their credible intervals overlaps only at the margin. From the joint posterior, the probability that Misiorowski's true K-rate is higher than Cease's posterior mean is 87.8 per cent. Versus Glasnow (posterior 30.06 per cent) it is 95.7 per cent. Versus McLean (30.01 per cent), 95.8 per cent. Even after the prior does its work, the data has shifted meaningfully in favour of "this guy is the best strikeout-pitcher in baseball, full stop".
The walk rate is the other story
High velocity and high K-rate normally come paired with worse command. The 2026 cohort scatter shows the cloud — a slight positive correlation between K% and BB% in the top quartile of K-rate, the residue of pitchers who throw too hard to land secondary stuff for strikes consistently.
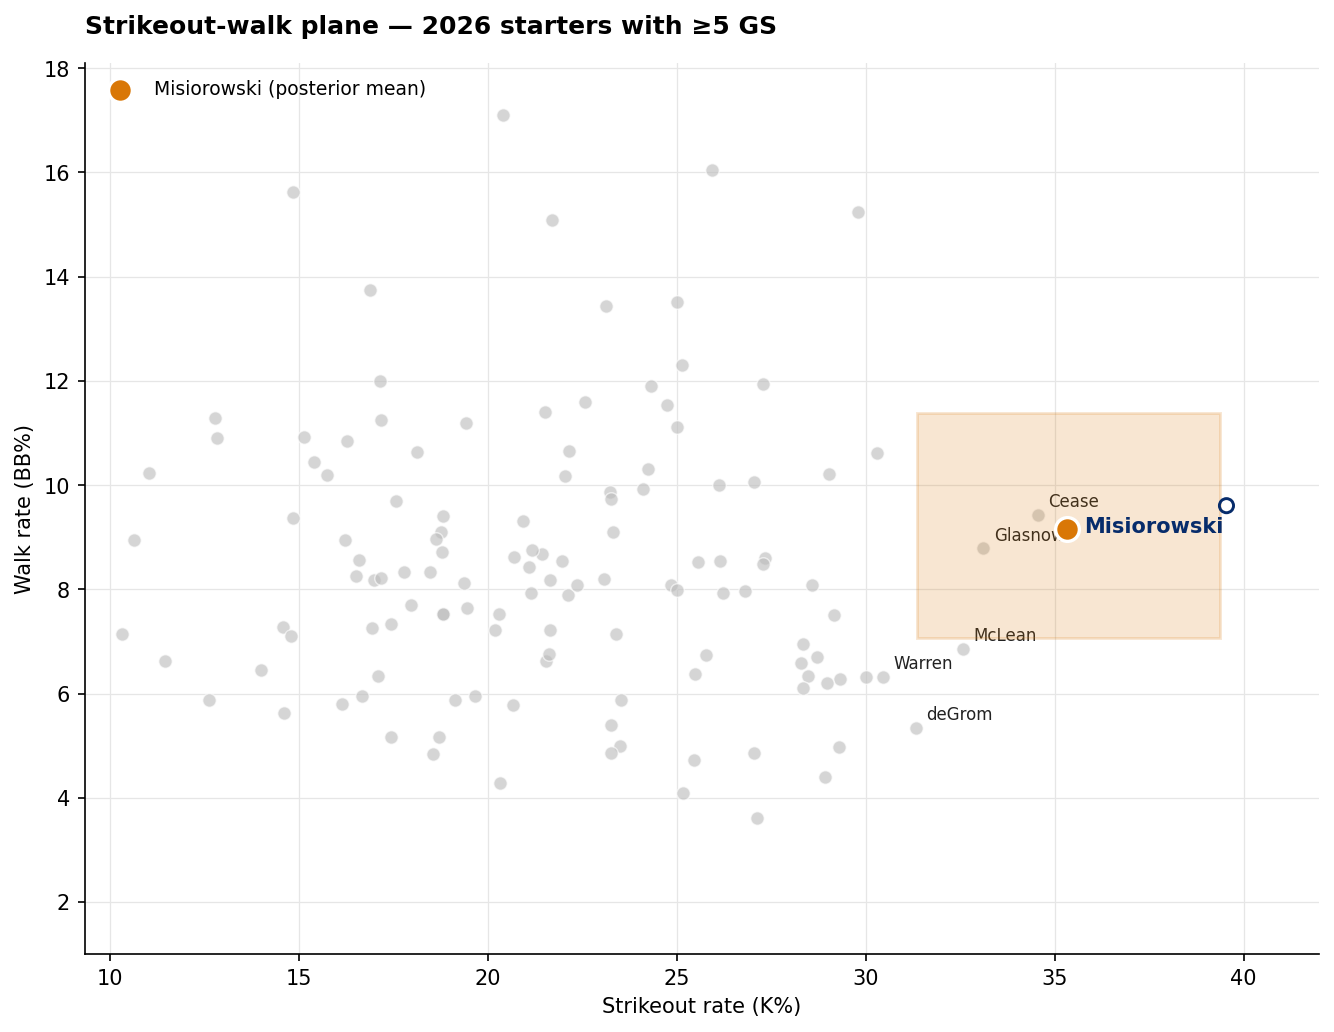
Misiorowski's raw walk rate is 9.60 per cent — 17 walks in 177 batters faced. The 2026 starter prior on BB% is Beta(9.56, 103.22) with population mean 8.5 per cent. Updated:
= Beta(26.56, 263.22)
Posterior mean: 9.17 per cent. 80% CI: [7.06 %, 11.39 %]. The interval includes the league-average 8.5 per cent — the data has not yet committed to the claim that he has a meaningful command issue. He could plausibly be a mildly below-average control pitcher (9.5 to 11 per cent) or a roughly league-average one (7 to 8.5 per cent), and the next twenty starts will say which.
The point on the plane that this paints is unusual. A K-rate three percentage points above any other 2026 starter paired with a BB-rate that has not yet differentiated from league average. The model class that produces that combination is "elite stuff plus passable command", which is the only model class that wins Cy Youngs. Garrett Crochet's 2025 was that. Paul Skenes' 2024 rookie year was that. Most rookies who flash Misiorowski's velocity end up on the wrong side of the cloud, not the right side.
The shrinkage on the rest of the field
The Bayesian framework also tells you something about the other twelve names ahead in the K-rate column. Each of them gets shrunk by the same prior, but the magnitude of the shrinkage depends on the sample size and how far they are from the population mean. Dylan Cease's 34.55 per cent on 191 batters faced shrinks to 31.71. Tyler Glasnow's 33.11 per cent on 148 shrinks to 30.06. The further from the prior mean, the more the posterior pulls back; the more batters faced, the less it pulls.
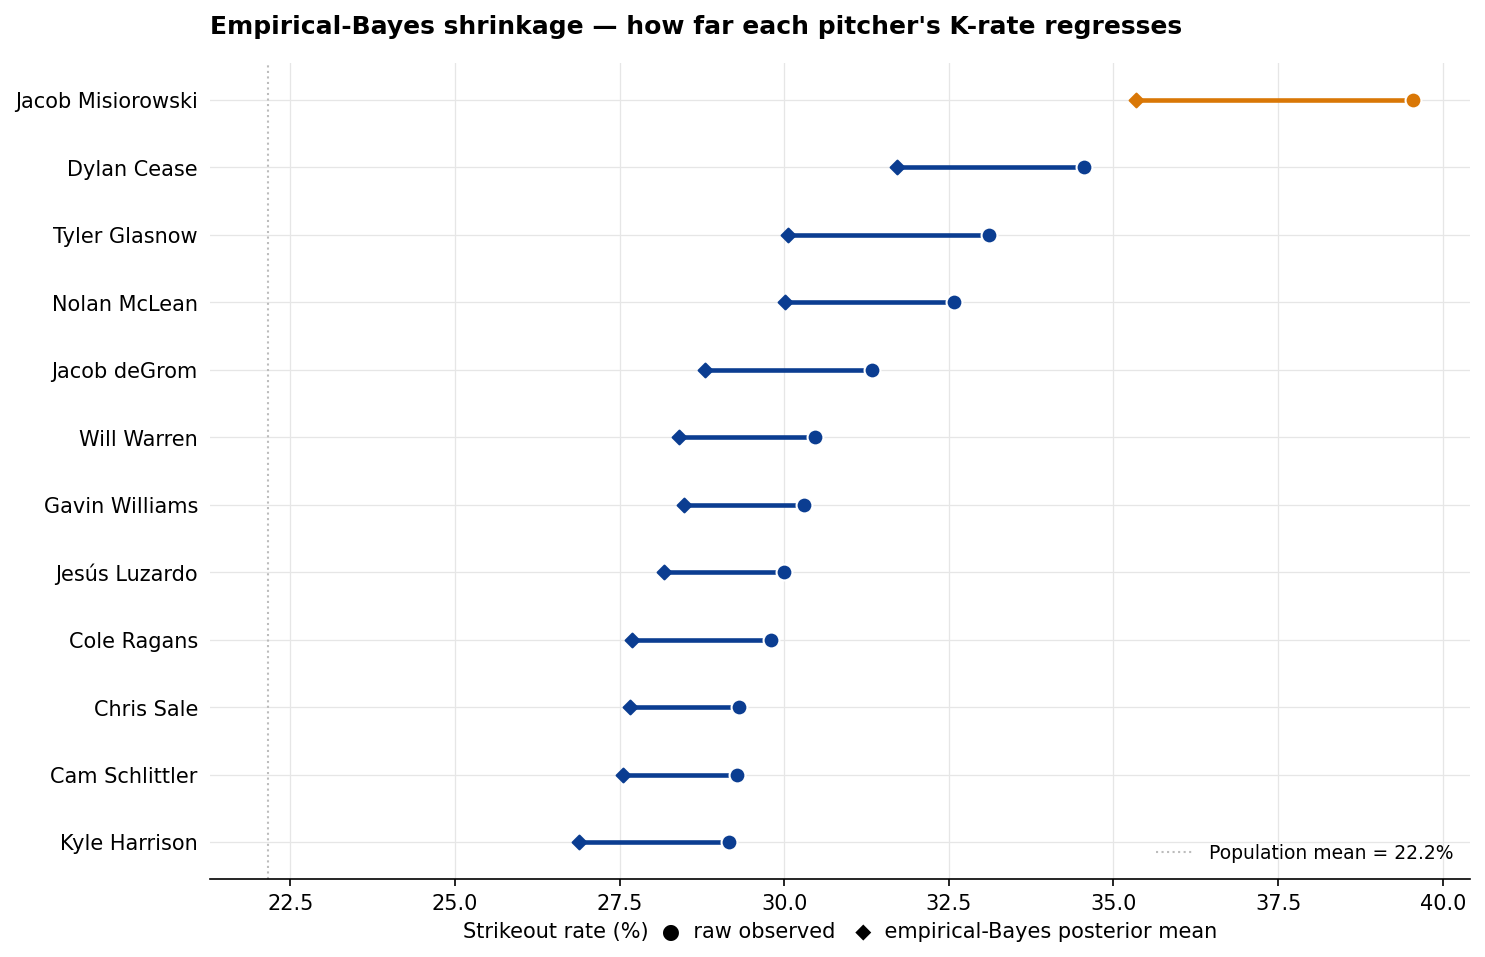
This is what regression-to-the-mean looks like in the data rather than in the abstract. The pitchers whose raw K-rates sit closest to the population mean barely move at all. The ones at the extreme end — Misiorowski, Cease, Glasnow — get shrunk hardest. The fact that Misiorowski's posterior survives a four-percentage-point haircut and still leads the league by more than three points is the strongest single statement of confidence the framework can make on this sample.
What the prior cannot answer yet
Two things the K-and-BB posteriors don't address. The first is durability. Tall hard-throwing rookies as a class have a documented history of running into elbows, shoulders, and innings limits — the data we have does not include height, velocity, or injury history, and we are not in a position to compute a hazard estimate for a "6'7"-and-throws-103-mph" cohort because the cohort has perhaps three members in the whole Statcast era. The honest version of this question is unmeasured.
The second is whether the velocity is doing the K-rate work or the secondary stuff is. The 103.6 mph fastball is the attention-grab; the model doesn't see pitch-by-pitch velocity and so cannot tell us how much of the K-rate is "hitters cannot catch up" vs "hitters chase the slider after they've seen a 103-mph heater". In sabermetrics literature this is the velocity-to-stuff translation; without Statcast pitch-level data ingested, the question is open here.
What the posterior can say: after eight starts, the prior on Jacob Misiorowski has updated decisively. He is, with very high probability, the best strikeout-pitcher in baseball right now. His walk rate is not yet a problem and may not become one. The next eight starts will tighten the credible interval; they will not change the rank.
Methodology: cohort is 2026 starting pitchers with at least 5 GS and 25 IP through 2026-05-09 (n=128). K-rate and BB-rate posteriors use empirical-Bayes Beta priors fit by method of moments to the cohort's K% and BB% distributions, then updated via the standard Beta-binomial conjugate to Beta(α + k, β + (BF − k)). Credible intervals are 80% percentile intervals on the resulting Beta. All data sourced from mlb_silver.stg_pitcher_game_log and mlb_silver.stg_player_metadata; Statcast pitch-level velocity figures cited as external (Brewers, MLB Stats; not ingested in this warehouse). Analysis script and starter cohort table in analysis/2026-05-misiorowski.