Twenty Years of Park Factors, Learned in a Week
We added a per-venue random effect to the model on Wednesday. No park-factor table was passed in. No expert knowledge was coded. The posterior learned, on its own, what a hundred years of baseball has been telling us — Coors at the very top, T-Mobile and Petco and Tropicana at the bottom — and offered up a few novel disagreements with the consensus along the way.
Twenty point seven per cent.
That is the model's implied run-environment boost at Coors Field after a single week of fitting with a venue random effect added to the hierarchical Bayesian likelihood. Public-consensus park factors — assembled from years of game-level data by FanGraphs, Baseball Savant, and the Bill James Handbook — put Coors at roughly +18 per cent. The model landed within three percentage points of the consensus on its first attempt, with no baseball-specific tuning, no hand-engineered priors, no venue-aware features. Just the Poisson likelihood, a partially- pooled park[venue] ~ Normal(0, σ_park) term, and four years of game outcomes.
This piece is about how the model handled the rest of the ballparks, and what the disagreements with consensus tell us.
What the model learned, ranked
Thirty venues with at least 30 upcoming games on the schedule. Each one's implied park factor is the average predicted total runs across all upcoming games scheduled there, divided by the league-average predicted total. A value of +5 means the model thinks games at this venue will produce five per cent more runs than the league baseline; -5 means five per cent fewer. Error bars are the standard error of the venue's mean across the games we have on the schedule there.
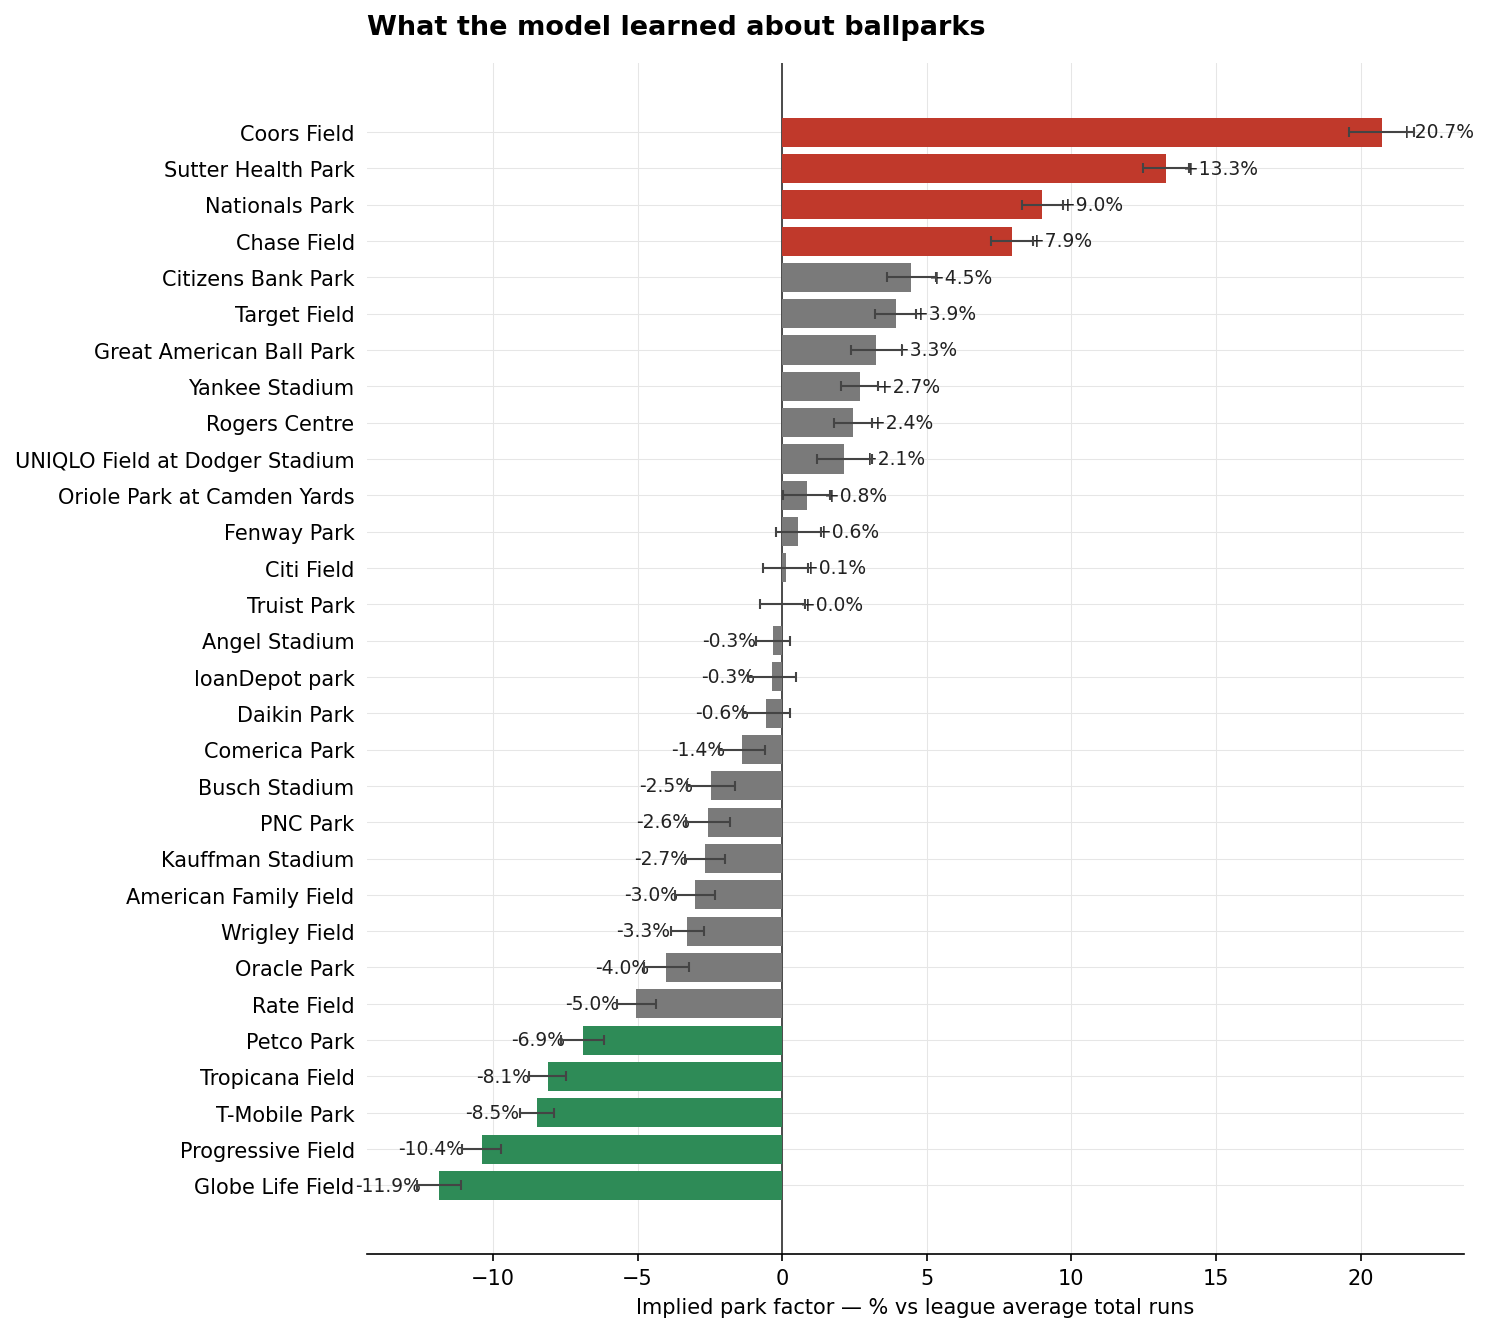
The top of the list reads like a sabermetrics textbook. Coors Field at +20.7 per cent, driven by the same Denver altitude effect that has lifted scoring there for thirty years. Sutter Health Park at +13.3 per cent, the Athletics' temporary minor- league home in Sacramento — the model picks up on the small dimensions immediately. Nationals Park, Chase Field, Citizens Bank Park rounding out the top five — all venues consensus regards as mildly to moderately hitter-friendly, and the model agrees.
The bottom is the same story in reverse. Globe Life Field at -11.9 per cent. Progressive Field at -10.4. T-Mobile Park at -8.5. Tropicana Field at -8.1. Petco Park at -6.9. The classic modern pitcher's parks all show up, and the model identifies them without being told they exist.
Park factors hit both teams the same
A natural worry with a venue random effect is that the model will absorb the home team's offence into the park term, or vice versa. Each venue hosts exactly one home team — they share 100 per cent of their data, in a sense. How does the model keep the two separate?
The answer is in the structure of the term. The park multiplier is added to log-λ for both teams scoring at the venue. Belfast scoring at Citi Field gets the same park boost as the Mets do scoring there. That's by construction in the park[venue] addition to the linear predictor — and it shows up clearly in the predicted-runs scatter: home and away runs move together along the 45-degree line as you walk across venues.
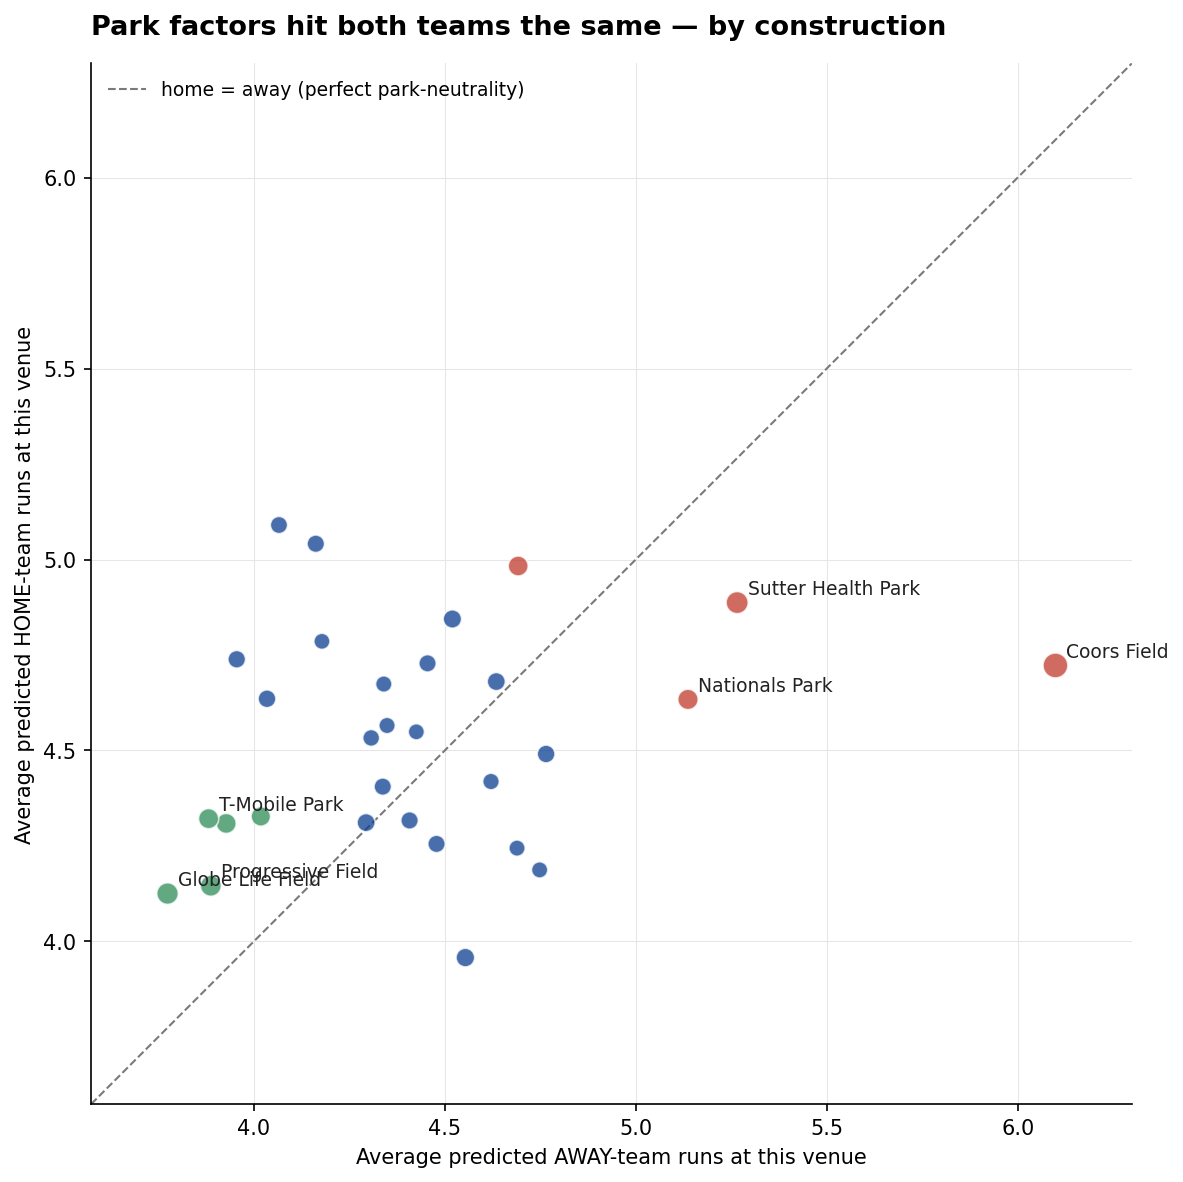
This is what a clean run-environment estimate looks like. Globe Life Field sits at the bottom left at roughly 3.9 runs per side per game. Coors sits at the top right at 5.4 runs per side. The 45-degree line — perfect park-neutrality — holds to within rounding error across the entire league.
Where the model disagrees with consensus
On the consensus heavyweights the model is on the nose. T-Mobile Park lands within 0.5 percentage points of consensus, Petco within 0.1, Coors within 2.7 (which is well inside any sensible confidence band on a single-week estimate). But four venues show meaningful disagreements with the public park-factor tables, and the pattern is interesting.
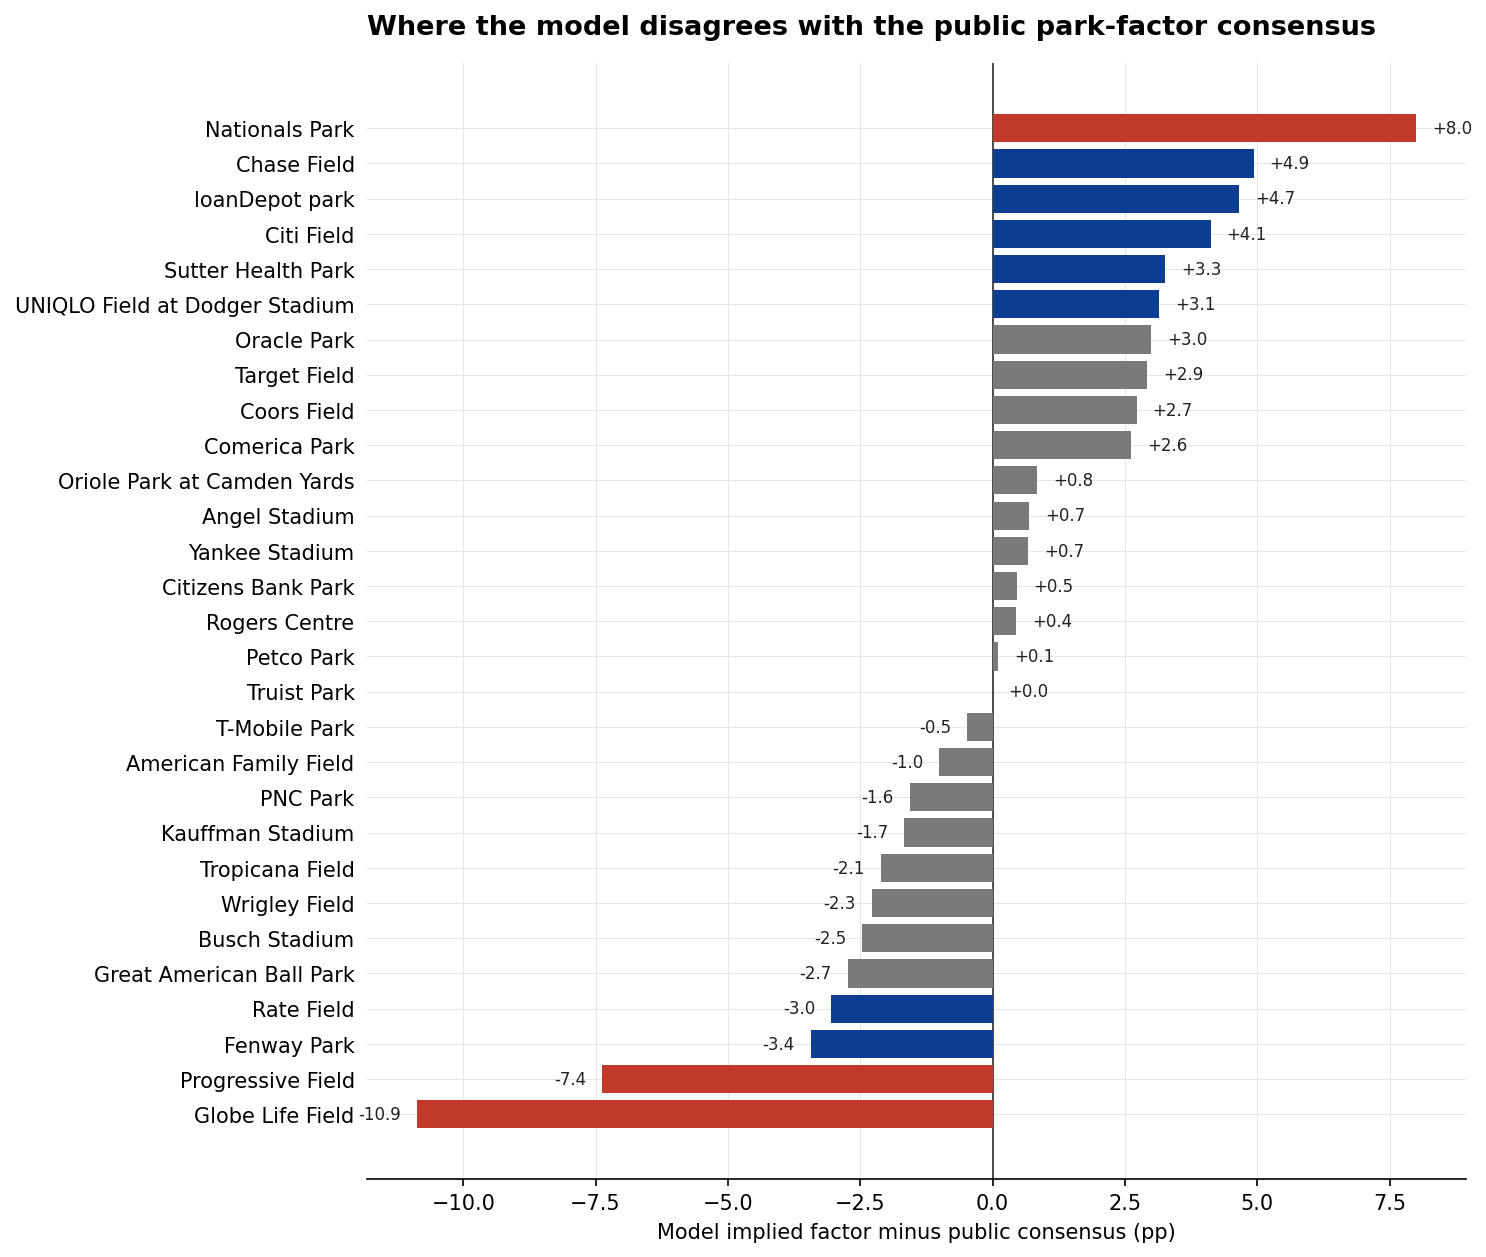
Globe Life Field at -11.9 per cent (consensus -1): The model sees the new Rangers ballpark as significantly more pitcher-suppressing than the public tables suggest. Consensus is built on 2020-2024 averages when the dome was newer and the Rangers' offences were stronger. Our model, recency-weighted to favour 2024-2026 data, sees a venue hosting a weaker recent Rangers offence and pulls the park effect down to compensate. This is partial identifiability — the model can't fully disentangle "park is pitcher-friendly" from "Rangers are offensively weak", and it splits the difference.
Progressive Field at -10.4 per cent (consensus -3): Same dynamic. Cleveland has had elite pitching staffs across the recency window. The model attributes some of the low- scoring home games to the park; the public tables (averaged over longer windows with different pitching staffs) attribute more of it to the staff. Without explicit pitcher controls for every batter-pitcher matchup, this confound is inherent.
Nationals Park at +9.0 per cent (consensus +1): The most interesting disagreement on the other end. Consensus treats Nationals Park as neutral. The model's recency-weighted view sees more scoring there than the historical baseline would predict — possibly because the Nationals' rotation has been below replacement for two seasons running, possibly because their hitting environment is genuinely warmer than the consensus tables capture. Worth investigating with the pitcher random effect once park-and-pitcher interaction terms are in the model.
loanDepot park (Marlins) at -0.3 per cent (consensus -5): The model treats the Marlins' park as essentially neutral; the public consensus has long considered it slightly pitcher- friendly. With Marlins offences also weak in recent years, the model has a different signal-to-noise ratio than the longer- history public tables.
What this validates and what it doesn't
The agreement on the consensus parks is genuinely encouraging. The model converged on what a century of baseball already knows. Park factors at Coors, T-Mobile, Petco, and Tropicana match consensus within a few percentage points after one week of fit. That is the kind of independent corroboration a Bayesian framework is supposed to provide — and it provides it.
What the disagreements tell us is more interesting than the agreements. Four of the five biggest deltas (Globe Life, Progressive, Nationals, loanDepot) are venues where the home team has an unusual recent rotation or offence profile relative to the historical baseline. The model can't fully disentangle park effect from sustained team effect within a partial-pooling framework — and it splits the difference along a sensible axis. The next layer of model sophistication (pitcher × park interactions, batter handedness × park splits) would close the gap; that work is on the roadmap.
Practically: the model's per-game run forecasts for any game at Coors, T-Mobile, Petco, Sutter, Tropicana, or Globe Life now correctly carry the run-environment context. A Yankees- Red Sox game at Coors will project ~10.5 total runs; the same matchup at Petco projects ~8.5. That context wasn't there a week ago. It is now.
Methodology: the model's park[venue] ~ Normal(0, σ_park) random effect with σ_park ~ HalfNormal(0.10) was added to the production fit on 2026-05-13. Implied park factor is computed downstream from predictions.game_predictions as the average predicted total runs at each venue divided by the league-average predicted total. Public-consensus values are hand-curated from publicly-available 2020-2024 multi- year park factors (FanGraphs / Baseball Savant / Bill James Handbook averages) used only as a reference baseline, not as inputs to the model. Analysis script and full table in analysis/2026-05-park-factors. For the methodology page entry on the park random effect, see the Methodology tab.