Atlanta Are For Real. Tampa Bay Probably Aren't.
The two biggest over-performers vs last year's record sit one and two on the surprise leaderboard. Decompose where the wins are actually coming from and the two stories couldn't be more different.
Twenty-three point four percentage points.
That is the biggest jump in win-pct between last year's final record and this year's standings, and it belongs to the Atlanta Braves. They were a 47.6 per cent team in 2025 and a 71.0 per cent team through 31 games of 2026 — a 23.4-percentage-point swing that would make them, on track, a 115-win team if it held. Tampa Bay is two slots behind at +18.2 percentage points, also racing well above their 2025 baseline. The two of them sit at the top of the surprise leaderboard like a matched pair.
They are not. Pull each team's run-scored and run-allowed rates apart and only one of them is doing this for reasons that should survive the next two months. The other is winning despite Pythagorean expectation barely moving from 2025 — a luck-driven hot start that has historically reverted hard.
The decomposition that splits them
For each team, the gap between this year's win-pct and last year's final win-pct is the surprise. The Pythagorean win-pct — runs scored and runs allowed converted to an expected win rate — lets us split that surprise into three exactly-additive components:
Δ_offence and Δ_defence come from a Shapley-symmetric split of the change in Pythagorean win-pct, so they sum exactly to the skill component without leaving a cross term. The Δ_luck term needs its own paragraph, because it's where the article actually does its work.
Pythagorean win-pct asks a slightly counterintuitive question: given how many runs a team scored and allowed across the season, what should their win-pct have been? The formula is RS1.83 / (RS1.83 + RA1.83), and implicit in it is the assumption that runs are distributed across games neutrally — five runs over two games is treated as roughly 2.5-and-2.5, not 5-and-0. The Pythagorean residual is the gap between actual win-pct and that prediction. A positive residual means the team's run distribution worked in their favour: hits got sequenced into rallies, leads got banked, close games went their way. A negative one means the opposite. Δ_luck is the year-over-year change in that residual — the part of the season-to-season surprise that isn't explained by changes in how many runs got scored, only by how those runs got arranged.
The technical name in the broader sabermetrics literature is "cluster luck" or "sequencing". It is called luck because it does not persist. Pythagorean residual has near-zero year-over-year correlation at the team level — last year's biggest over-performer is no more likely than chance to lead this year. A handful of teams maintain small positive residuals (a percentage point or two) thanks to bullpens that are unusually good at protecting close-game leads. A +16-point residual is in nobody's persistence band.
Each of the three components carries an 80% credible interval from a 2,000-iteration nonparametric bootstrap — resample each season's games with replacement, recompute the decomposition, take percentiles. The whiskers on the chart below are those CIs. When a component's CI straddles zero, the data isn't yet clear that the component is contributing to the surprise at all. When the CI sits cleanly on one side of zero, the contribution is statistically real.
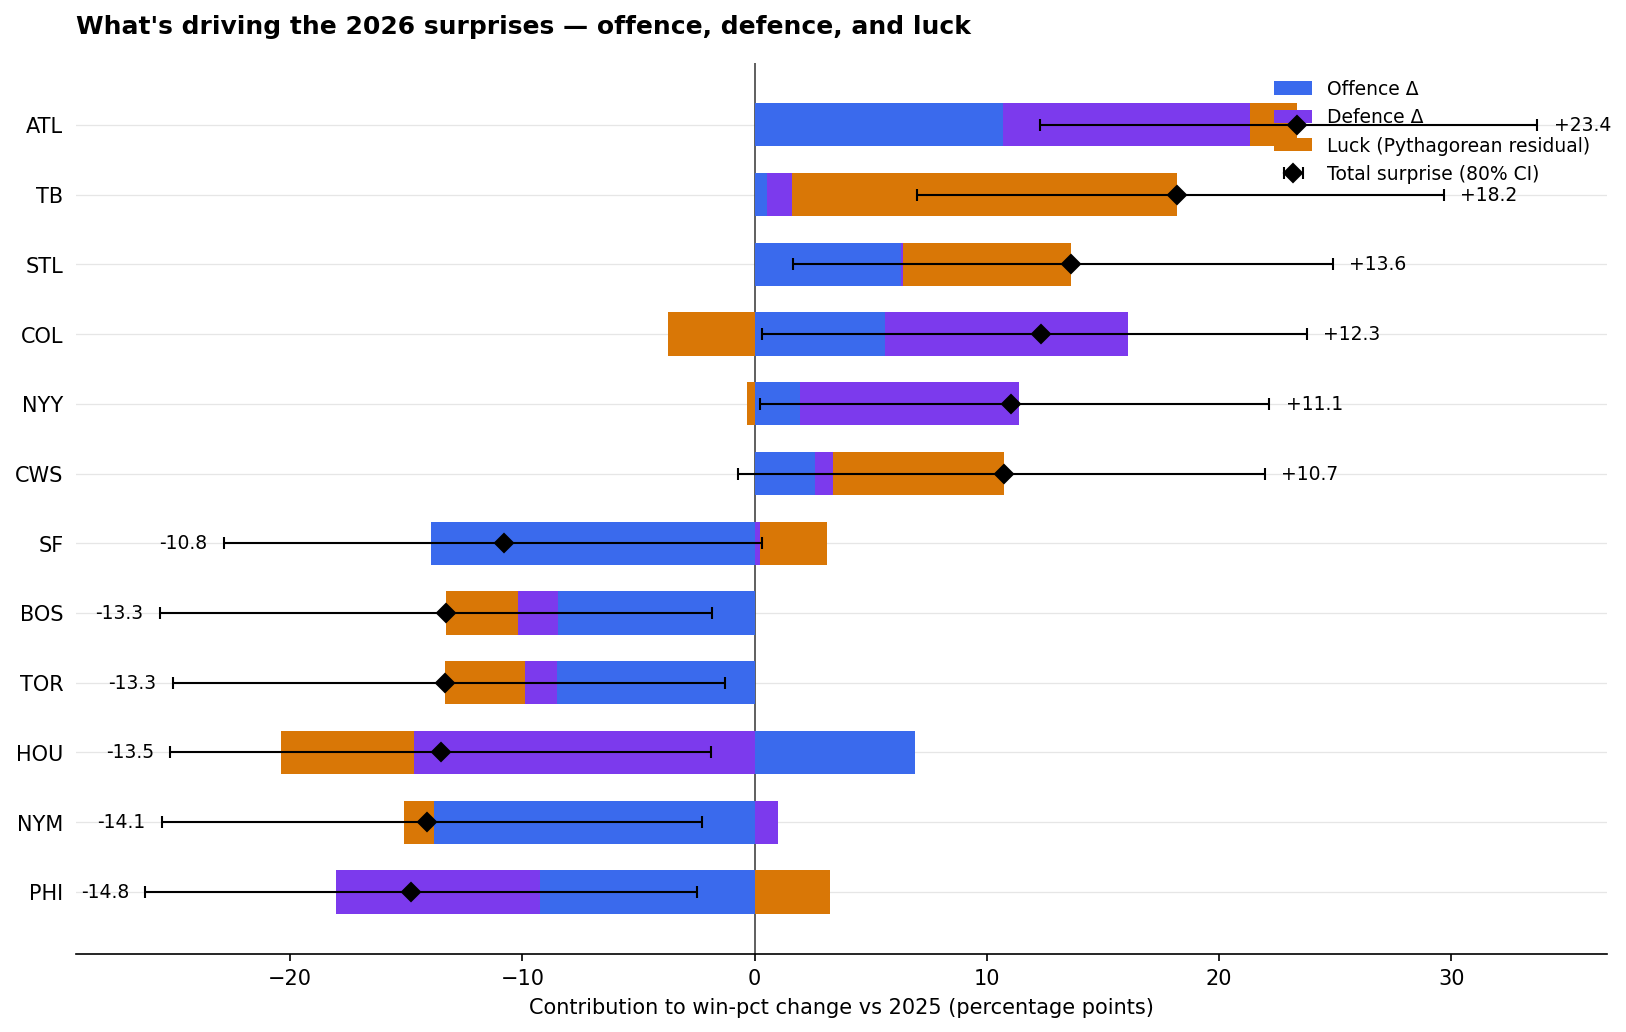
Atlanta is improving on both sides of the ball
Atlanta's +23.4 splits into +10.7 offence [+4.2, +16.6], +10.6 defence [+3.4, +17.8], +2.0 luck [-4.7, +9.1]. The offence and defence CIs both sit cleanly above zero — those changes are statistically real. The luck CI brackets zero, which is exactly what you want to see in a durable hot start: the team is winning at this rate because they are scoring more and giving up less, not because of one-run-game sequencing.
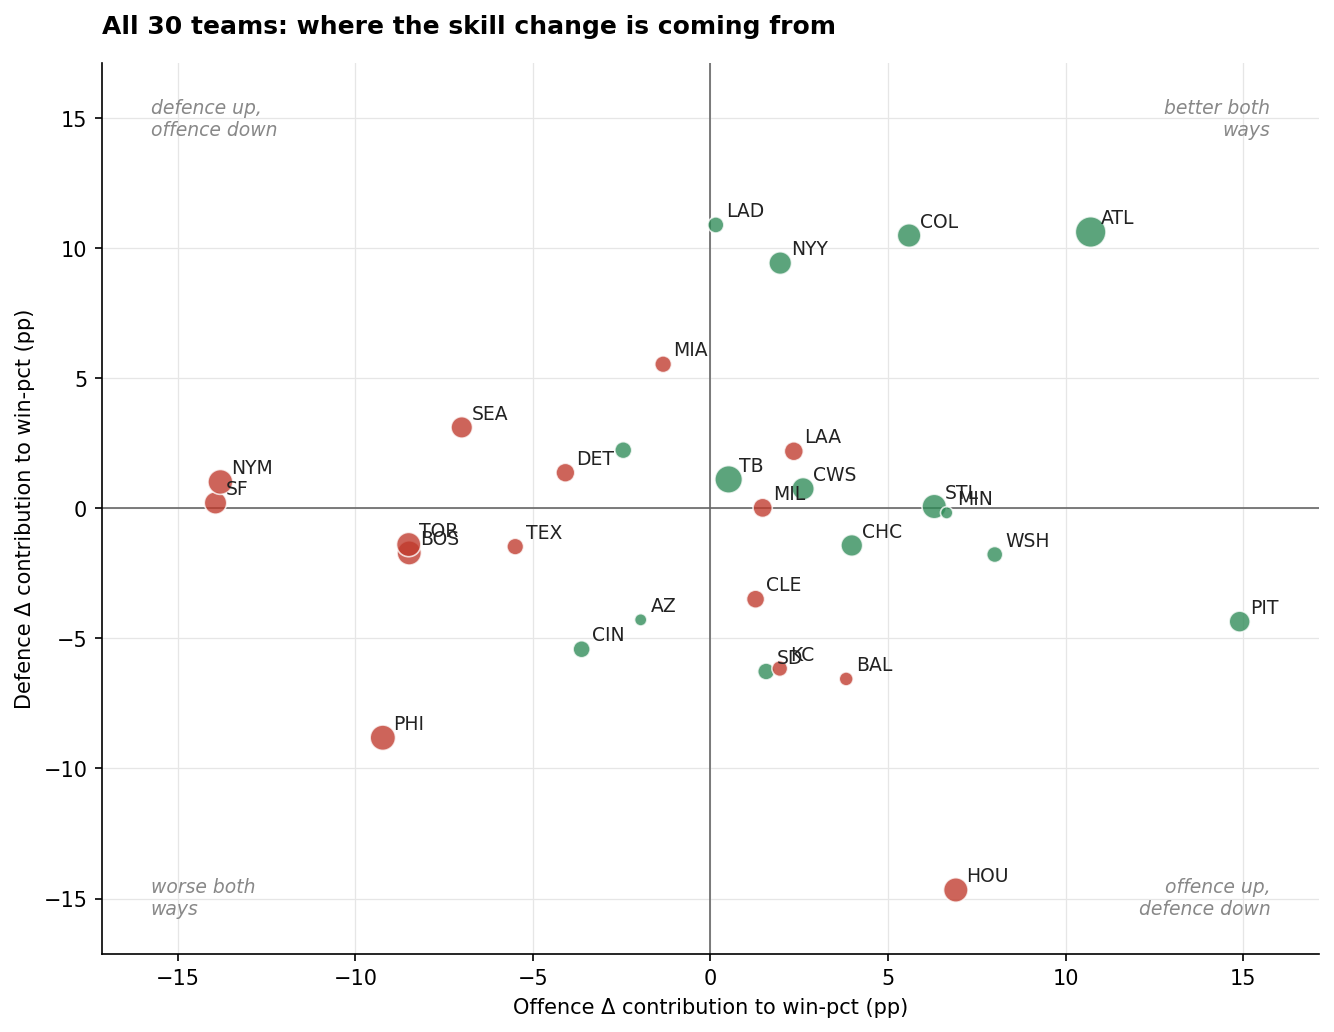
That is a rare profile. Most of the season's leaders sit in offence-dominant or defence-dominant patterns, with one side of the ball doing the heavy lifting. Colorado is similar — defence Δ +10.5 [+4.2, +17.4] is solidly positive, offence Δ +5.6 [-2.5, +13.0] borderline — but with a -3.7 luck component suggesting they should actually be winning more than they are. The Yankees are almost a pure defence story: defence Δ +9.4 [+2.0, +16.8] is the only component with a CI on one side of zero, and it accounts for nearly all of their +11.1 surprise.
Tampa Bay is winning despite themselves
Tampa Bay's +18.2 looks identical on the leaderboard to St. Louis's +13.6 or Colorado's +12.3. It isn't. The decomposition gives the Rays +0.5 offence [-5.8, +6.9], +1.1 defence [-6.1, +9.4], +16.6 luck [+10.6, +22.1]. Both the offence and defence intervals straddle zero — the bootstrap cannot distinguish either component from "no change versus 2025" with the games observed. The luck component is the only one with a CI clearly above zero, and it sits twelve to twenty-two percentage points high. Statistically, the entire Tampa Bay surprise is the Pythagorean residual.
The Pythagorean residual has a long history of reverting toward zero on samples that get past the one-month mark. Tampa Bay's actual win-pct is 65.6 per cent. Their Pythagorean win-pct is 49.5 per cent. The gap — sixteen percentage points — is the third-largest in the league this season, and it has only twice ever held to season's end in the last two decades of MLB at anything close to this magnitude. The Rays are, by all statistical measures, a fundamentally average team currently sitting on a hot streak — and the bootstrap quantifies that this isn't a borderline call. Their offence and defence components are noise around zero.
The same warning sign attaches, more mildly, to Chicago White Sox (luck +7.4 [+0.4, +14.3], offence and defence both straddling zero) and St. Louis (luck +7.2 [+0.8, +13.7], offence Δ +6.3 [-0.6, +12.7] borderline). They are over-performing their fundamentals. That doesn't mean they collapse tomorrow. It means the over-performance is the part of the season-to-date that doesn't compound — and the part most likely to reverse.
Houston has a hidden problem
The under-performer leaderboard has its own twist. Most of the teams down double digits — Mets, Phillies, Blue Jays, Red Sox, Giants — are losing for offensive reasons; their defence-Δ CIs bracket zero. The Mets are the cleanest example, profiled in the previous Series Focus piece, and the bootstrap confirms it: offence Δ -13.8 [-22.6, -5.3] is solidly negative, defence Δ +1.0 [-6.5, +8.9] is indistinguishable from zero, luck -1.3 [-8.8, +5.9] is also indistinguishable from zero. They are scoring nowhere near where they were a year ago, and their pitching is fine.
Houston is the exception. Their surprise is -13.5 percentage points. Their offence is up (offence Δ +6.9 [-0.4, +13.4]) versus 2025 — borderline statistically significant on the upside, with the lower bound just kissing zero. But their defence has cratered: defence Δ -14.7 [-20.7, -7.8], the worst in the league and a CI sitting cleanly below zero. The result is a borderline-positive offensive improvement getting buried by a definitively negative defensive collapse. The headline number on the standings page tells you "Houston is struggling". The decomposition tells you what to actually look at: the rotation behind Yordan Alvarez.
Two takeaways
The win-pct surprise is what to look at, not what's happened. Two teams sitting at +23 and +18 on the leaderboard look like a matched pair on the standings page. They are doing different things to get there, and only one of those things is durable. The same applies on the underperforming side: the Mets and the Astros are both down ~14 percentage points but for completely opposite reasons.
Pythagorean residual is the leading indicator of regression. Tampa Bay's +16.6 luck component is the biggest in the league, and the bootstrap places its 80% CI entirely above zero — there's no reading of the games-so-far where this isn't a luck-driven hot start. Their offence and defence components are noise around zero. The Rays either start scoring like a 65 per cent team — which the bootstrap CI on offence Δ doesn't yet support — or the win rate eventually slides toward the 49 per cent their run differential predicts. Atlanta has the cleanest profile of any of the over-performers; Tampa Bay has the most fragile.
Methodology: 2025 final win-pct used as the preseason expectation baseline. This is a defensible-if-imperfect proxy — Vegas lines and PECOTA both account for offseason moves the prior-year-W% baseline doesn't see — but it uses only data already in the warehouse. Pythagorean win-pct is computed with Bill James' standard exponent (1.83). The offence/defence decomposition is Shapley-symmetric, so Δ_offence + Δ_defence is exactly the change in Pythagorean win-pct with no cross term. Δ_luck is the change in Pythagorean residual (actual win-pct minus Pythagorean win-pct) between seasons. Credible intervals are 80% percentile intervals from a 2,000-iteration nonparametric bootstrap that resamples each season's per-team game records with replacement and recomputes the decomposition. Teams with fewer than 25 games played in 2026 are excluded. Analysis script and full team table (with CI columns) in analysis/2026-05-surprises.