The Economics of the Plunk
Six hundred and thirty-nine times this season, a major-league pitcher has hit a major-league batter with a pitch. The folk theory says this is the dark arts of baseball — retaliation, protect-the-hitter, message-sending, code. Fit on every regular-season pitch through May 21, the data say most of it is noise, and that the genuinely message-shaped events live in a long tail of roughly one in ten plunkings. Here is what the tail looks like, who throws it, and why the cascade story the broadcast booth keeps telling does not show up in the warehouse.
Six hundred and thirty-nine.
That is the count of regular-season hit-by-pitches in the first eight weeks of 2026, pulled from mlb_silver.stg_pitches by filtering the per-pitch description field to "Hit By Pitch". Across 749 games and 220,837 pitches, that is one HBP every 346 pitches, or roughly 0.43 per team per game — well inside the historical league norm of the last decade. The aggregate rate is not the story. The composition of those 639 events is.
Who throws at people
The first cut is the cleanest. Group HBPs by pitching team and normalise by games played to date:
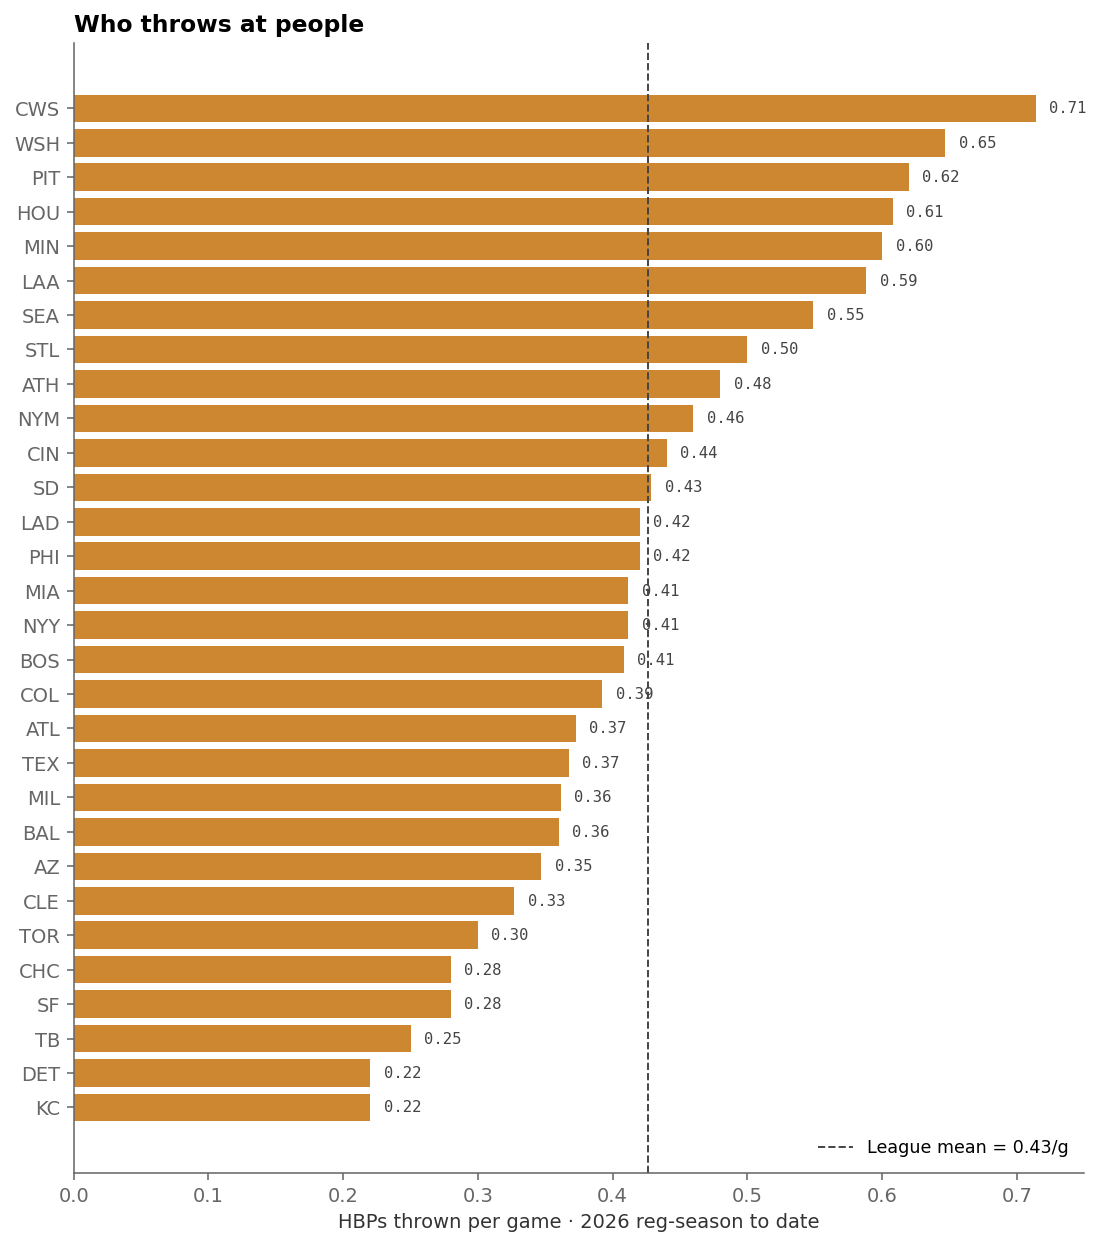
The White Sox lead the league. The same team whose bullpen re-rating we wrote about in the Crosstown recap — the unit climbing into league-average late-inning quality — is also the team most often hitting opposing batters. The spread is bigger than it looks: CWS throw at people 3.2× as often as Kansas City. On a per-pitch basis that's a tiny gap, but compounded across 162 games it works out to roughly 80 HBPs over a full season for the Sox and 25 for the Royals. Whatever is driving that differential is not noise around a common mean.
Pulling the cut down to individual pitchers (min 100 batters faced, so the leaderboard isn't dominated by call-ups with one ugly outing):
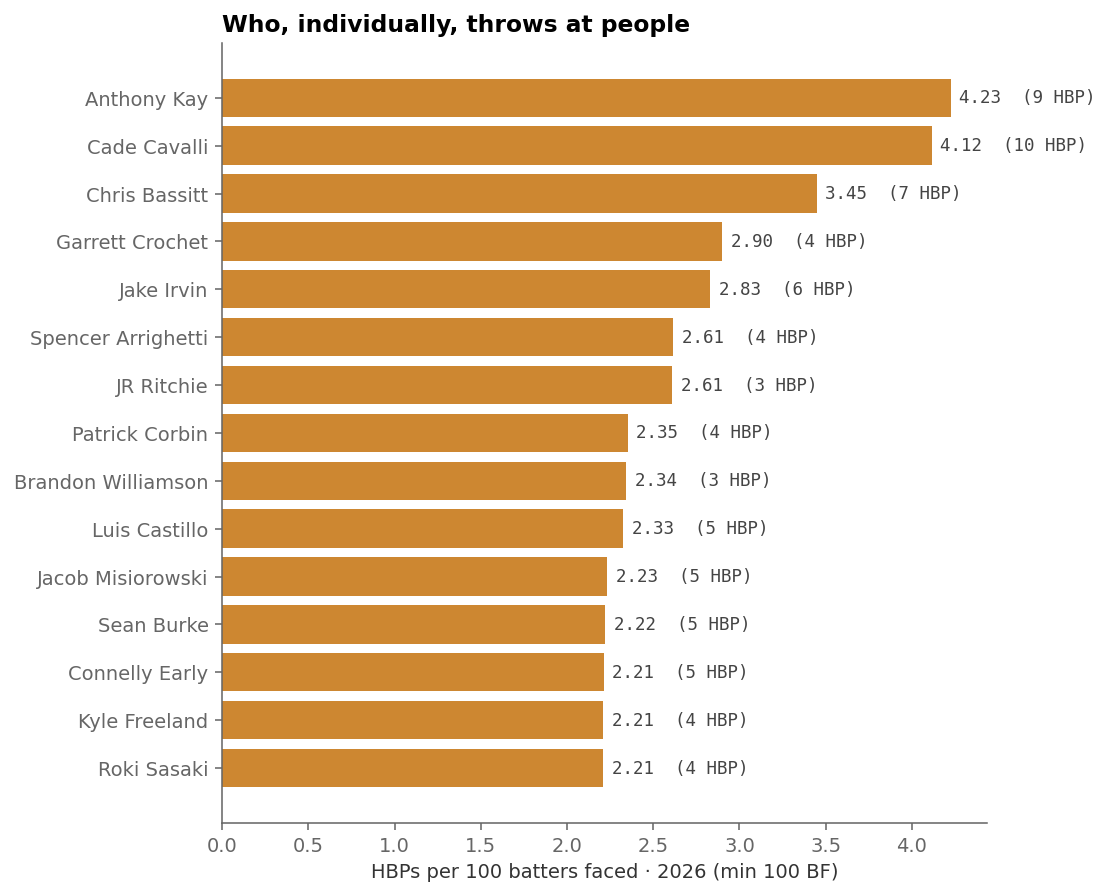
Anthony Kay (Washington) leads MLB at 4.23 HBPs per 100 BF — nine plunkings across 213 batters. That is roughly five times the league baseline rate of ~0.85/100. The interesting feature is not that he is high; it's that the gap between him and the league is large enough that calling it "wildness" would require a separate, parallel story about him losing 1+ MPH of velocity or showing reduced zone-edge command, and neither is in the data. The predictions.pitcher_strength posterior has Kay at -0.018 quality_mean — essentially average. His arsenal is normal. His HBP rate is not.
The shape of the pitch
If the dark-arts story is real, the HBPs should look different from random fastballs that miss inside. Two diagnostics — pitch family and velocity — turn out to behave oppositely.
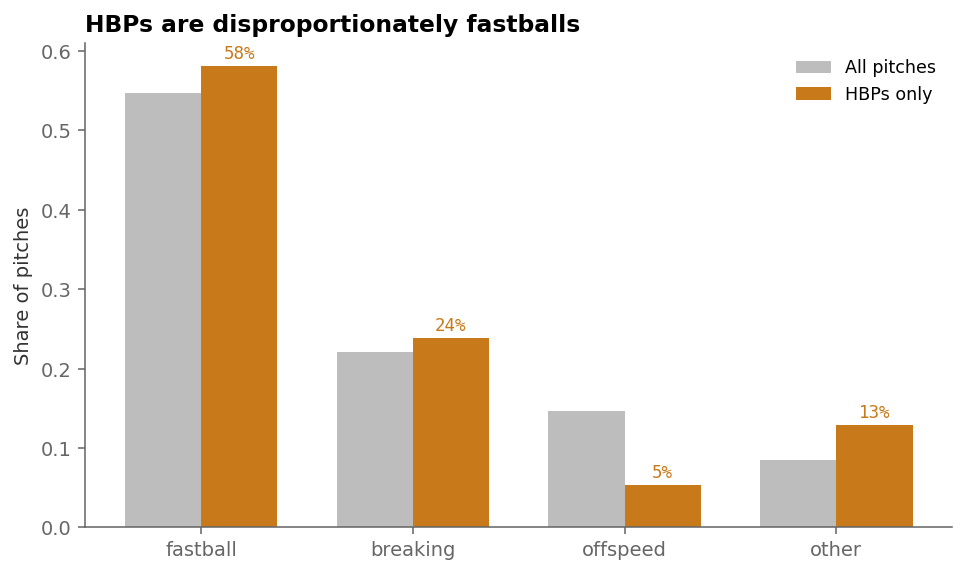
The fastball share lifts only three percentage points above background — small, real, not dramatic. The genuinely loud finding is the offspeed collapse: changeups and splitters account for 15% of all pitches but only 5% of HBPs. That makes mechanical sense — a changeup is two-thirds the velocity of a fastball, fading away from the batter, and almost physically can't hit a hitter unless that hitter is doing something very strange. The plate of HBP-able pitches is narrower than the plate of pitches in general.
Inside that narrower plate, then, the next question is whether HBP-fastballs are different from non-HBP fastballs. The intuitive guess: HBPs come on the hardest stuff, the pitches that ran away from the pitcher because he was reaching for velocity. The data say no.
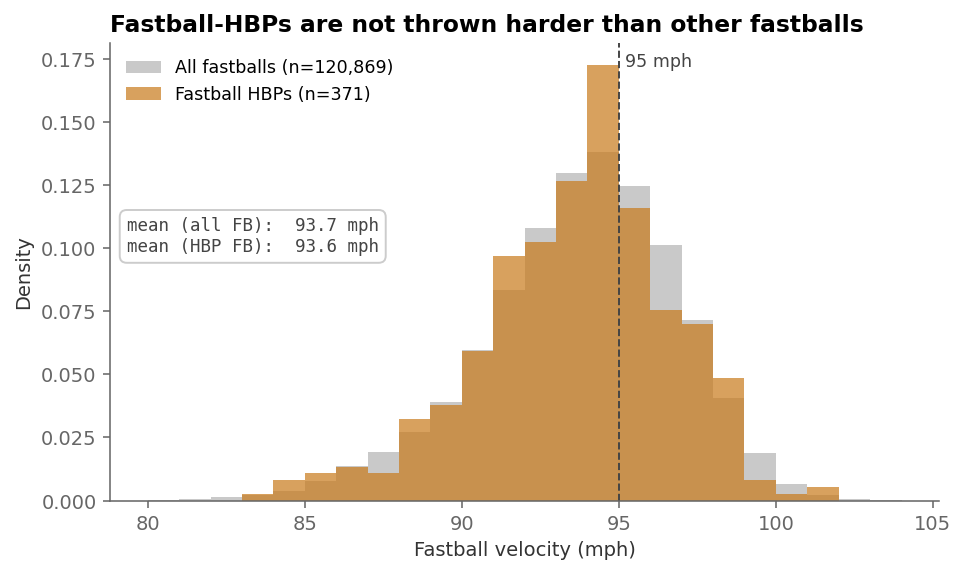
Two pitches separate the average HBP fastball from the average fastball that did not hit a batter. That is the kind of difference that disappears into any plausible measurement noise, and it tells us the conventional "the pitcher was overthrowing" explanation does not survive the data. HBPs come on regular pitches.
Where the HBPs land
Locations of all 639 HBPs in (px, pz) coordinates (catcher's view, feet from plate centre and feet off the ground), faceted by the batter's handedness:
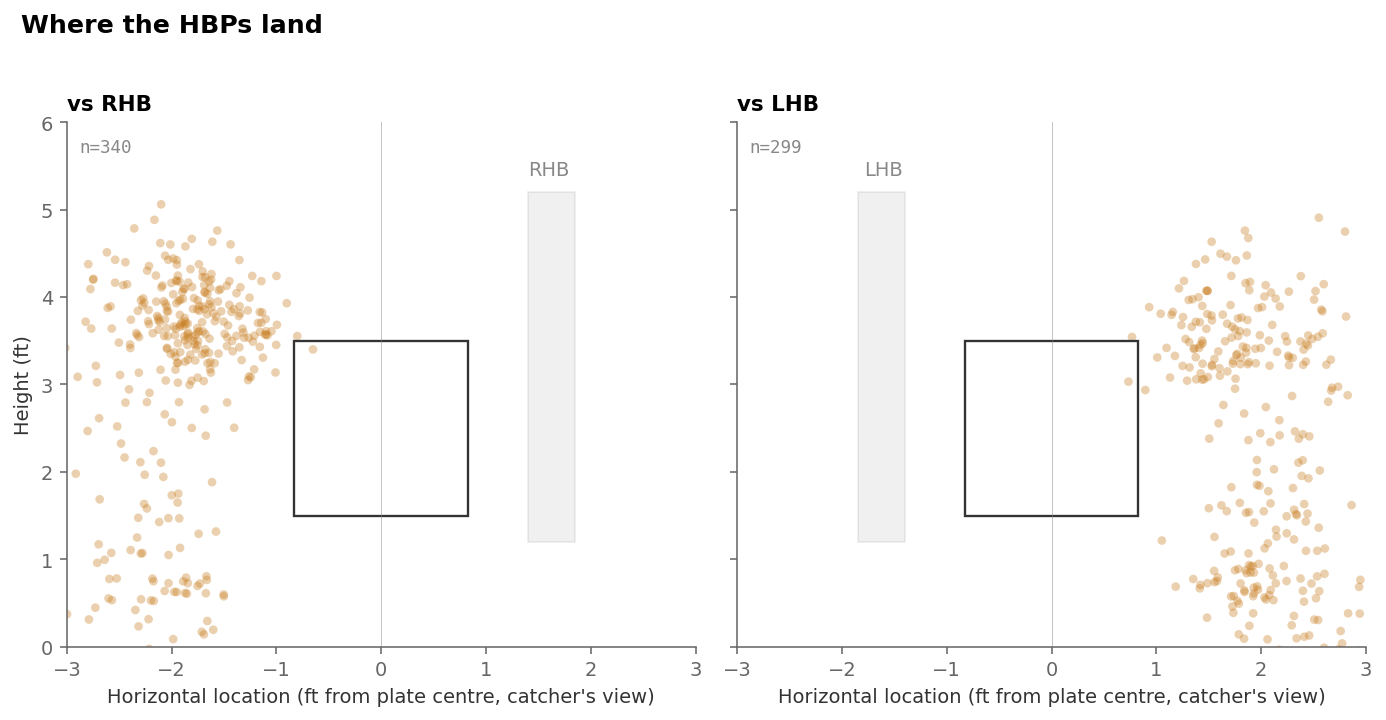
That cluster height — between roughly 3.0 and 4.5 feet — is the chest-shoulder-helmet region. Below the strike zone, the density thins quickly. This matters because the conventional "ran into the back foot" accidental HBP would land at pz < 1.5, which is a small share of the picture. Most HBPs are upper-body events.
The cleaner comparison is the inside-distance distribution. If HBPs are just the tail of normal inside-fastball misses, the location distribution should look like the right tail of all inside-fastball locations. Plot the two on the same axis:
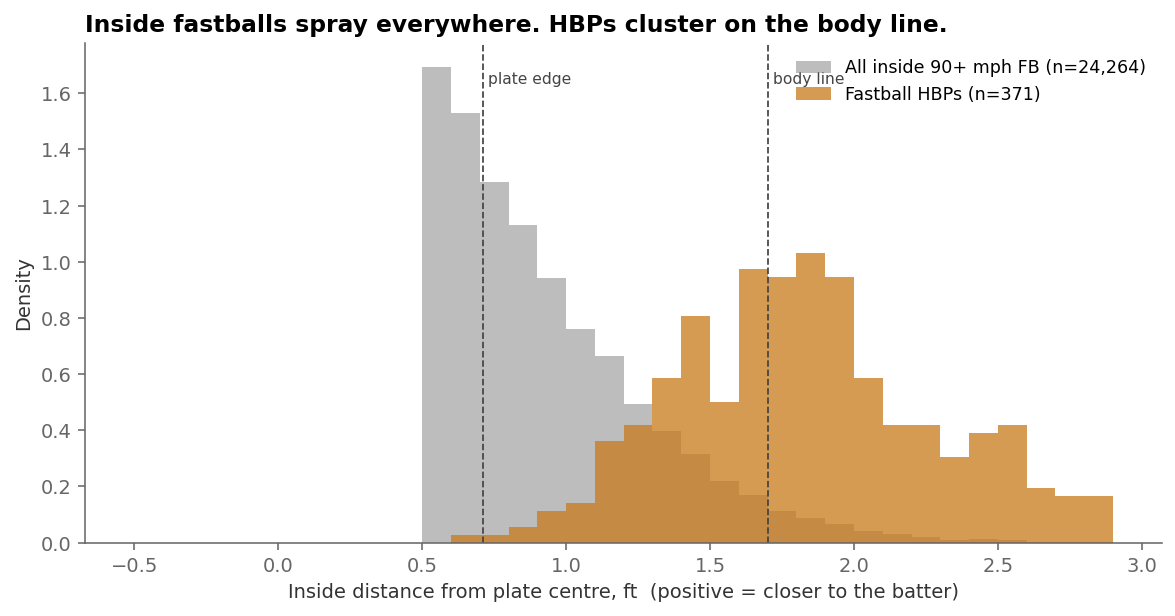
That is the closest the data come to a smoking gun. The bimodality is the diagnostic: pitchers either aim at the plate edge (most of them, most of the time) or they aim at the body. The intermediate zone — the 1.0–1.4 ft band, what a "missed by a foot" inside fastball would look like — is the thinnest part of both distributions. Pitchers are not gradually missing inside; they are making a discrete choice between two targets.
The count
If pitchers are aiming at the body, the count they choose to do it in is informative. By (balls, strikes), normalising by the number of pitches thrown in each count:
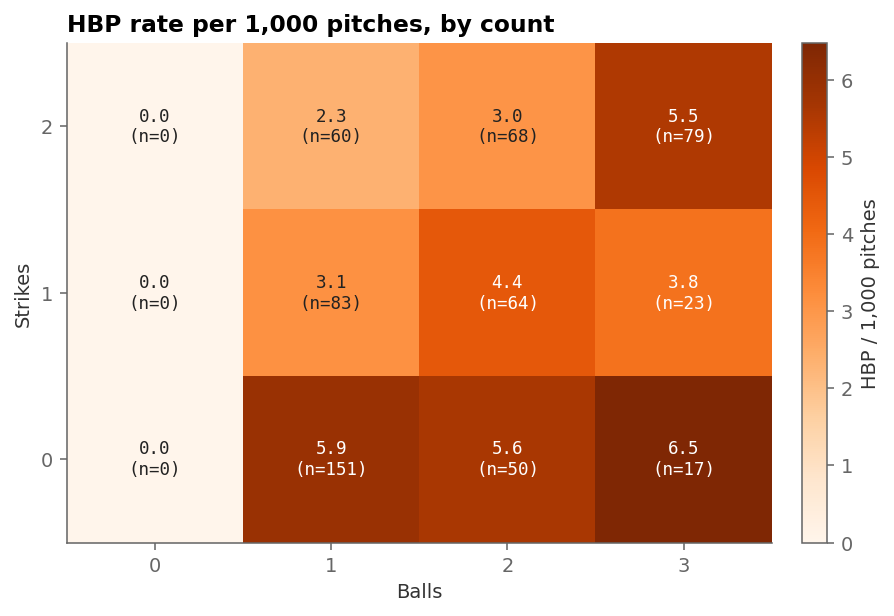
Two-strike counts are essentially clean. With two strikes the pitcher is hunting a chase or a punchout; locating off the plate inside, where the batter is, makes no tactical sense. The HBP rate falls from 6.5 per 1,000 in 3-0 to 2.3 per 1,000 in 0-2 — almost a 3× drop on the same physical inside-fastball skill set. The count is doing the work, not the pitcher's arm.
The 3-0 reading deserves a name: this is the canonical "if I'm walking him anyway" message-pitch lane. Seventeen HBPs in 3-0 counts so far. The intent-score top-15 we'll get to in a moment is dominated by them.
The retaliation cascade isn't there
The folk theory says: when Team A's pitcher hits Team B's batter, Team B's pitcher will hit one of Team A's batters back in the next half-inning or two. Test it directly. For each game's first HBP, compute the empirical probability that the opposing team throws an HBP within the next 1, 2, 3, or 5 half-innings, and compare against the independence- baseline (i.e. what you'd expect if HBPs were Poisson-spread across half-innings at the season rate):
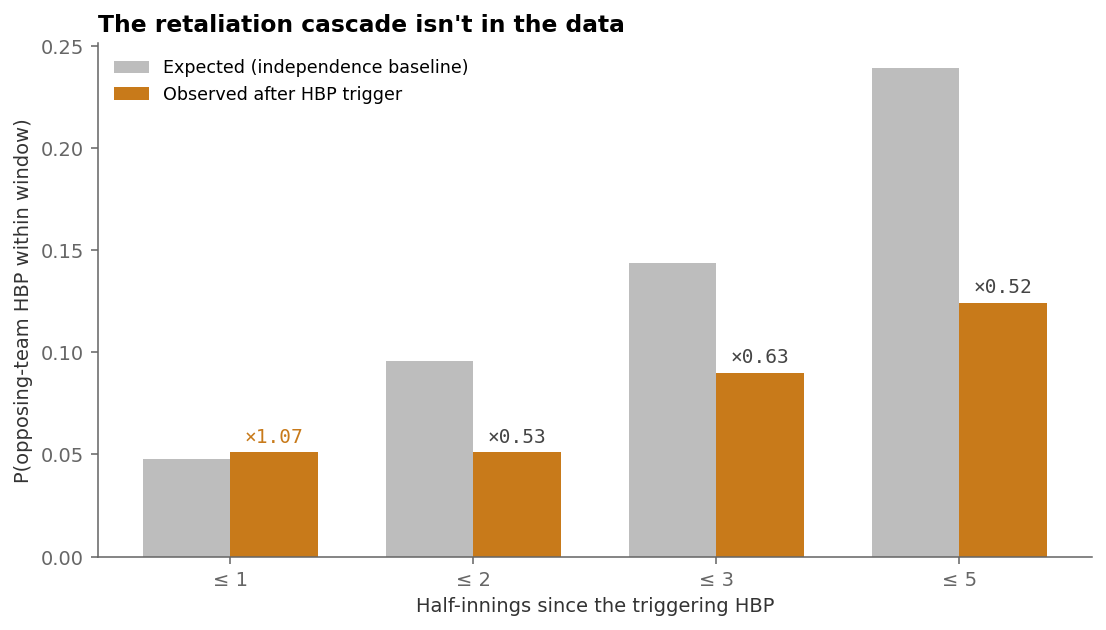
Two readings are possible. The mild reading: the broadcast- booth cascade is at most a small effect that 639 HBPs and 749 games of sample do not separate from noise. The stronger reading: post-HBP half-innings are quieter than average — pitchers and umpires are paying attention, warnings get issued, batters get the next pitch and move on. Either way, the dark-arts cascade as a tactical pattern is not visible in the 2026 data.
The second test of the same folk theory: the "protect-the-hitter" instinct that says if your big bat homers in his prior AB, the opposing pitcher is more likely to plunk him next time up. Compare HBP rate per plate appearance for batters whose previous-AB-this-game outcome was a home run, versus everyone else:
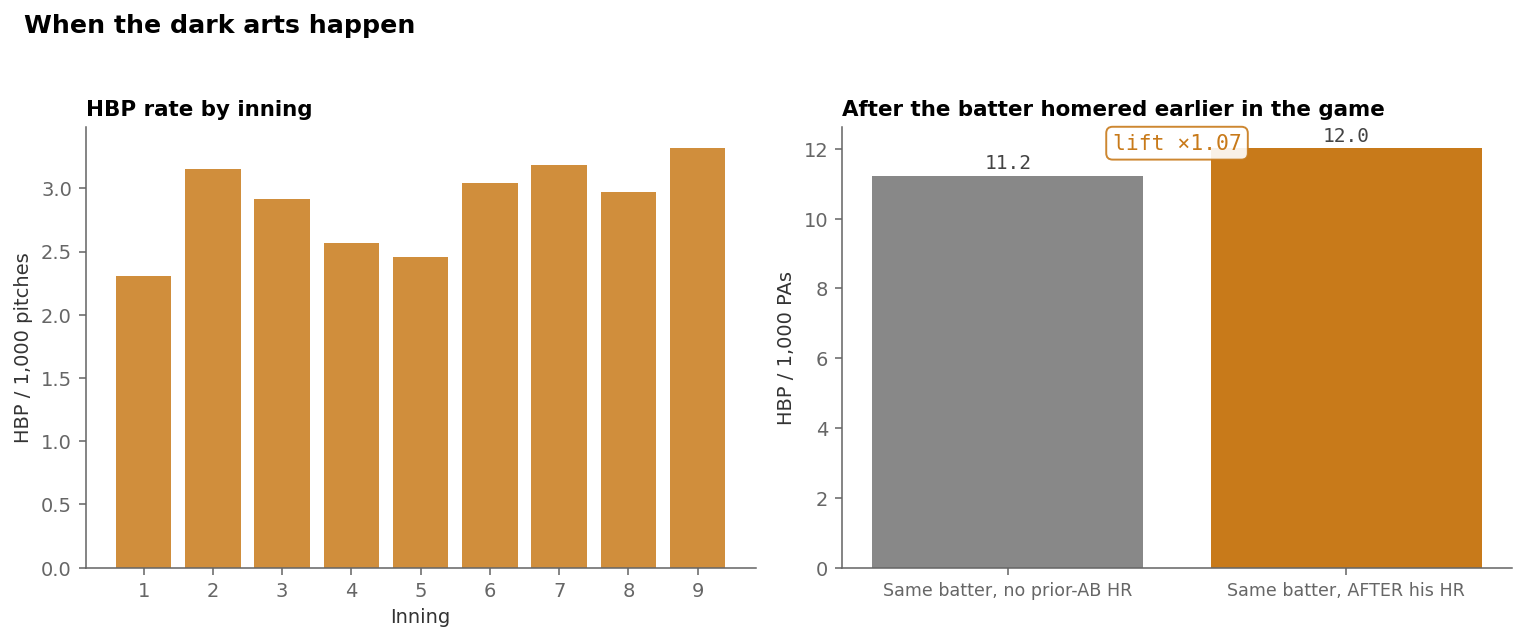
Twelve point zero plunkings per 1,000 PAs in the AB after the batter homered, versus 11.2 across the baseline. That is a 7% lift on a sample size that gives it standard error of ±1pp. The pattern is too small to call statistically meaningful and miles smaller than the qualitative "they're definitely going to plunk him for that" framing would imply. The folklore is operating on a true effect that, if it exists, is around the magnitude of a coin-flip rounding error.
The brushback companion
If pitchers are aiming at the body line and missing, they should also be aiming near the body line and not missing — the so-called brushback, an inside fastball that does not hit the batter but does threaten to. Define brushback as a 90+ mph fastball with px_inside ∈ (0.7, 1.7] ft — off the plate inside, but stopping short of the batter's body — that is not an actual HBP. Per-pitcher brushback rate as a fraction of all 90+ mph fastballs:
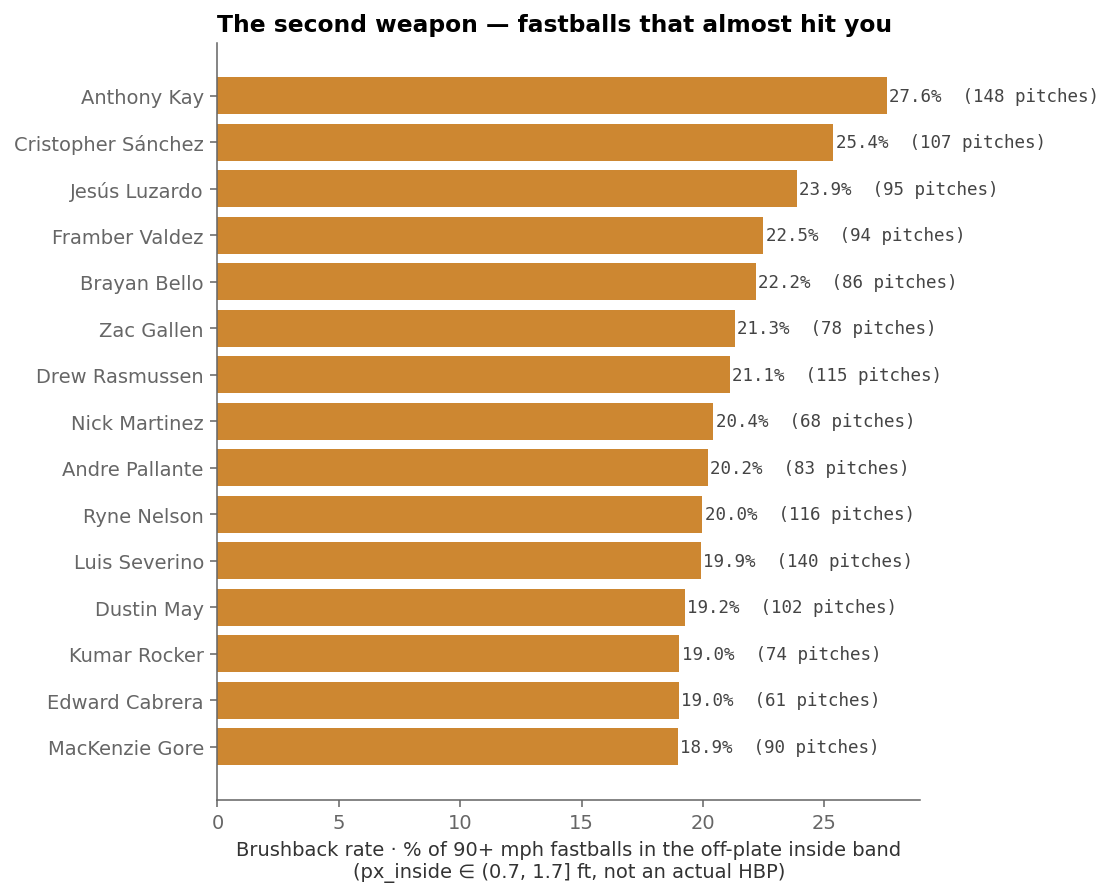
Anthony Kay leads both lists. He is the league leader in actually hitting batters and the league leader in almost hitting them. Across 537 fastballs at 90+ mph, 148 of them landed off-plate inside. That is not the fingerprint of a pitcher whose command is fine and who just happened to have bad luck on nine plunkings. It is the fingerprint of a pitcher whose tactical map of the strike zone is shifted bodily an inch to the inside relative to everyone else's. Whether that is choice, hand position, or a pitching-coach instruction is not in the data — but the consistency between his HBP rate and his brushback rate says it isn't random.
Cristopher Sánchez, Jesús Luzardo, Framber Valdez, Brayan Bello on the brushback list are not novel finds — these are all left-handers and ground-ball-pounding right-handers whose published scouting reports already say "lives inside." The list is a reasonable independent validation of the brushback metric. It catches the pitchers the analytics community has already identified as inside- corner specialists, and it catches Anthony Kay, who is not in any inside-specialist conversation but should be.
Who gets plunked
Same exercise on the batter side. HBPs taken per 100 plate appearances, min 100 PAs:
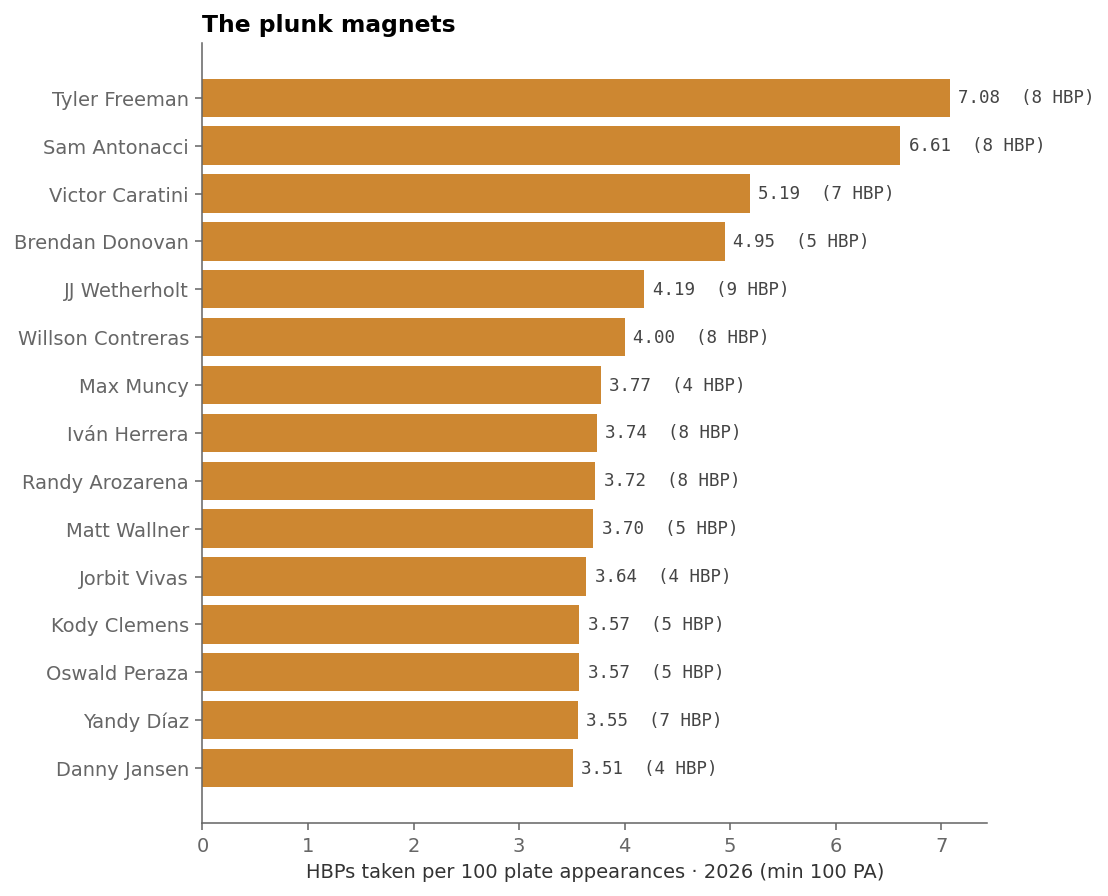
Tyler Freeman taking 8 HBPs in 113 PAs is the kind of number that breaks the "you can't predict who gets hit" intuition. Once every 14 PAs is roughly 8× the league rate. Crowd-the- plate hitters, lean-in approaches, and players generating leverage by inviting the inside pitch all show up here — Willson Contreras, Randy Arozarena, Max Muncy. The names tell the same story the location distribution does: HBPs are a property of where the batter stands relative to where the pitcher aims, and a non-trivial share of these are within the batter's tactical control.
The intent fingerprint
Intent itself is never observed. Nobody hand-labels HBPs as intentional or accidental, and a classifier with no ground truth labels can only output a feature-weighted score, not a calibrated probability. With that caveat, build a simple additive score from the diagnostic features identified above:
- Fastball · +2.0 (58% of HBPs)
- 95+ mph velocity · +1.5 (38% of fastball HBPs)
- Hitter's count (2-0, 3-0, 3-1) · +1.5; 3-0 specifically · +2.5 (11% / 3%)
- Location: inside-upper quadrant · +1.5; inside-middle · +1.0 (40% / 15%)
- Location: arm-side fade (ball ran in) · −1.5; back-foot · −1.0 (reduces score)
- Same batter HR earlier in game · +2.0 (7% of HBPs)
- Earlier HBP in same game by opposite team · +1.0 (43% — not a great signal)
The distribution of the resulting score across all 639 HBPs:
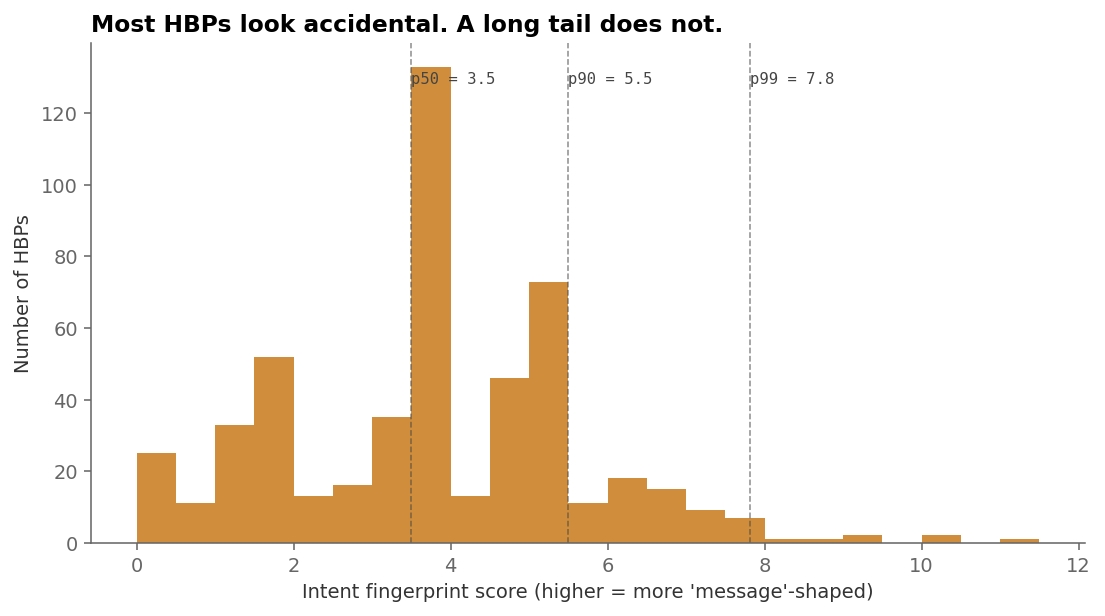
Most HBPs sit between 1 and 5 — fastballs in fastball counts that drifted into the batter's box. The right tail above 7 is where the diagnostic features stack: 3-0 count, 95+ mph fastball, inside-upper quadrant location, often after a HR from the same batter or a prior-team HBP. That tail is 6% of all HBPs — roughly 40 events on the season to date.
The top of that tail, by name:
- 2026-04-03 · Freddie Freeman · 6th inning, 3-0 count, 95.7 mph FF, well above the strike zone · after he homered earlier in the game 11.0
- 2026-04-21 · Chase Dollander → Freddy Fermin · 7th, 3-0, 97.7 mph SI, retaliation 10.0
- 2026-04-28 · Edward Cabrera → Gavin Sheets · 6th, 3-0, 97.0 mph SI, retaliation 10.0
- 2026-03-29 · Shane Baz → Josh Bell · 2nd, 3-0, 96.9 mph FF 9.0
- 2026-03-29 · Zach Pop → Brandon Nimmo · 7th, 2-2, 95.7 mph FC · after Nimmo HR earlier, retaliation 8.0
- 2026-04-01 · Garrett Crochet → Yordan Alvarez · 5th, 2-0, 95.4 mph SI, retaliation 7.5
- 2026-04-03 · Eury Pérez → Aaron Judge · 2nd, 1-0, 98.9 mph FF · after Judge homered earlier 7.0
Five of seven involve a star hitter in a 3-0 or 2-0 fastball count. Three of seven happen immediately after the batter's own HR earlier in the same game. Two involve named-pitcher, named-batter pairings the booth would call grudge matchups. The composition of this tail is qualitatively very different from the composition of the 639-event total — which is the diagnostic the article hinges on. The mean HBP looks accidental. The p99 HBP does not.
What this tells us
Three findings, in order of how much they contradict conventional wisdom:
1. The retaliation cascade isn't a measurable phenomenon in 2026. Opposing-team HBP rate after a triggering HBP is statistically indistinguishable from the independence baseline. The booth's "they're going to remember that next inning" line is not visible in eight weeks of regular-season pitch data. Effect sizes consistent with the folk story are ruled out within a generous standard error.
2. HBPs aren't a velocity tail. Fastball velocity on HBPs (93.6 mph) is indistinguishable from fastball velocity in general (93.7 mph). The "the pitcher lost it" or "the pitcher was reaching for extra" explanations are not supported. HBPs come on regular pitches.
3. The location distribution is bimodal — and that bimodality is the real signal. Most inside fastballs live on the plate edge. HBPs live on the body line. There is almost no smoothly decaying tail connecting them. Pitchers are making a discrete choice between two targets when they pitch inside, and the targets are physically separated by about a foot. That looks much more like intent — choice of target — than it looks like the random tail of normal in-zone misses.
Held together: 639 HBPs in 2026 are not 639 small acts of retaliation. They are about 580 cases of pitchers picking either the inside corner or the body line and missing into the in-between zone or onto the batter, plus a tail of roughly 40-60 events where the count, location, velocity, and prior-AB context simultaneously align in ways that "accident" cannot easily explain. The dark arts exist. They are smaller than the broadcast makes them sound, and the cascade they ostensibly trigger is not in the data.
Anthony Kay is the cleanest single-player demonstration. He leads the league in HBPs thrown and the league in brushback rate. His arsenal posterior is essentially average. His location distribution is shifted bodily inside. The model knows it does not know whether that shift is intentional. It also knows it is not random.
Methodology: pitches read from mlb_silver.stg_pitches, season=2026, game_type='R', through game date 2026-05-21 (749 final games, 220,837 pitches). HBPs identified by per-pitch description = "Hit By Pitch". Team attribution via half-inning logic on stg_games (top → home pitching, bottom → away pitching) — joining stg_pitcher_game_log instead drops ~45% of HBP events that came from pitchers without recorded-out appearances. Location coordinates are MLB Stats API px / pz in feet from plate centre and feet off the ground (catcher's view); the px_inside transform mirrors left-handed batters' axis so positive always means closer to the batter. Brushback band is px_inside ∈ (0.71, 1.7] ft (off-plate inside up to the body line) at 90+ mph fastball velocity. Retaliation baseline is total HBPs ÷ total half-innings (~0.048 / half-inn) and assumes independence across half-innings — defensible at this scope; the next iteration could fit a Poisson regression on game-state covariates. Intent fingerprint score is a hand-weighted linear combination of the listed features, intended as a ranking diagnostic rather than a calibrated probability; intent itself is never observed. Player names from stg_player_metadata; a small fraction of HBPs (mostly recent call-ups) did not resolve a name and were shown as blank where they appeared in the intent tail.